| Start Page |
|
 |
| Start Page |
|
|
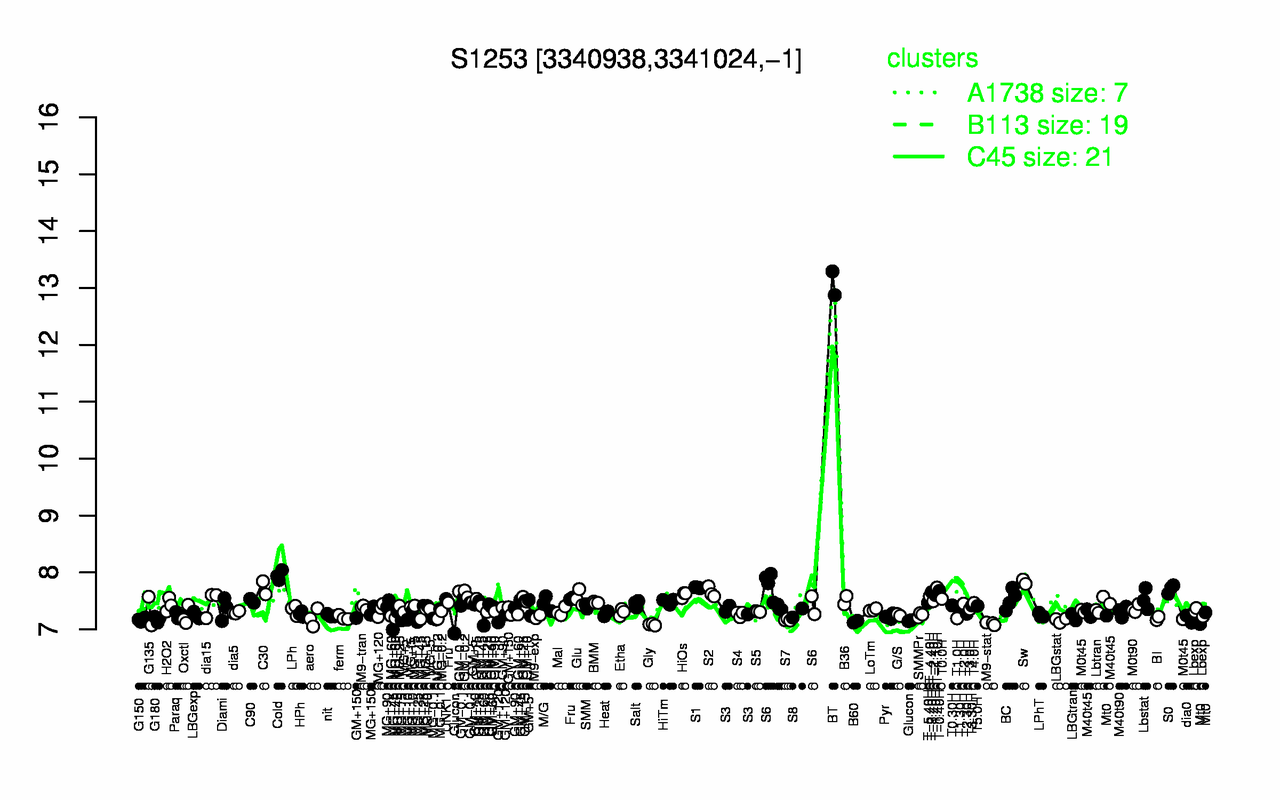
| BT | Cold | Sw | T-1.10H | S1 | C30 | S0 | T-0.40H | T-3.40H | S2 |
| 13.1 | 7.95 | 7.84 | 7.73 | 7.73 | 7.73 | 7.71 | 7.68 | 7.65 | 7.65 |
| Glucon | Gly | M9-stat | B60 | MG+45 | LBGstat | S7 | G150 | G180 | GM+120 |
| 7.08 | 7.08 | 7.1 | 7.13 | 7.16 | 7.16 | 7.17 | 7.17 | 7.18 | 7.19 |