| Start Page |
|
 |
| Start Page |
|
|
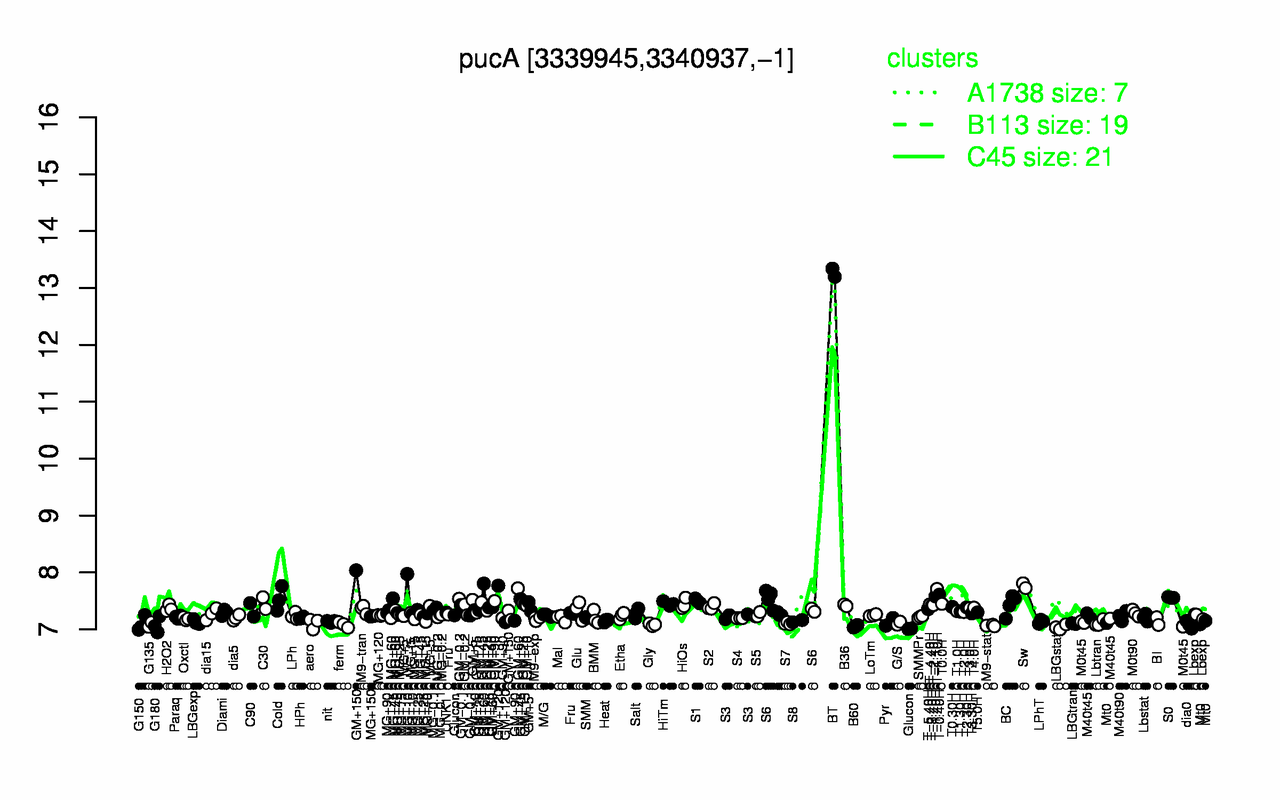
| BT | Sw | T-1.10H | GM+60 | T-0.40H | T-1.40H | S0 | Cold | GM+150 | MG+10 |
| 13.3 | 7.77 | 7.71 | 7.64 | 7.61 | 7.58 | 7.56 | 7.53 | 7.51 | 7.51 |
| LBGstat | B60 | M9-stat | G180 | dia0 | ferm | Gly | G135 | Glucon | G150 |
| 7.04 | 7.05 | 7.07 | 7.08 | 7.08 | 7.08 | 7.08 | 7.08 | 7.09 | 7.09 |