| Start Page |
|
 |
| Start Page |
|
|
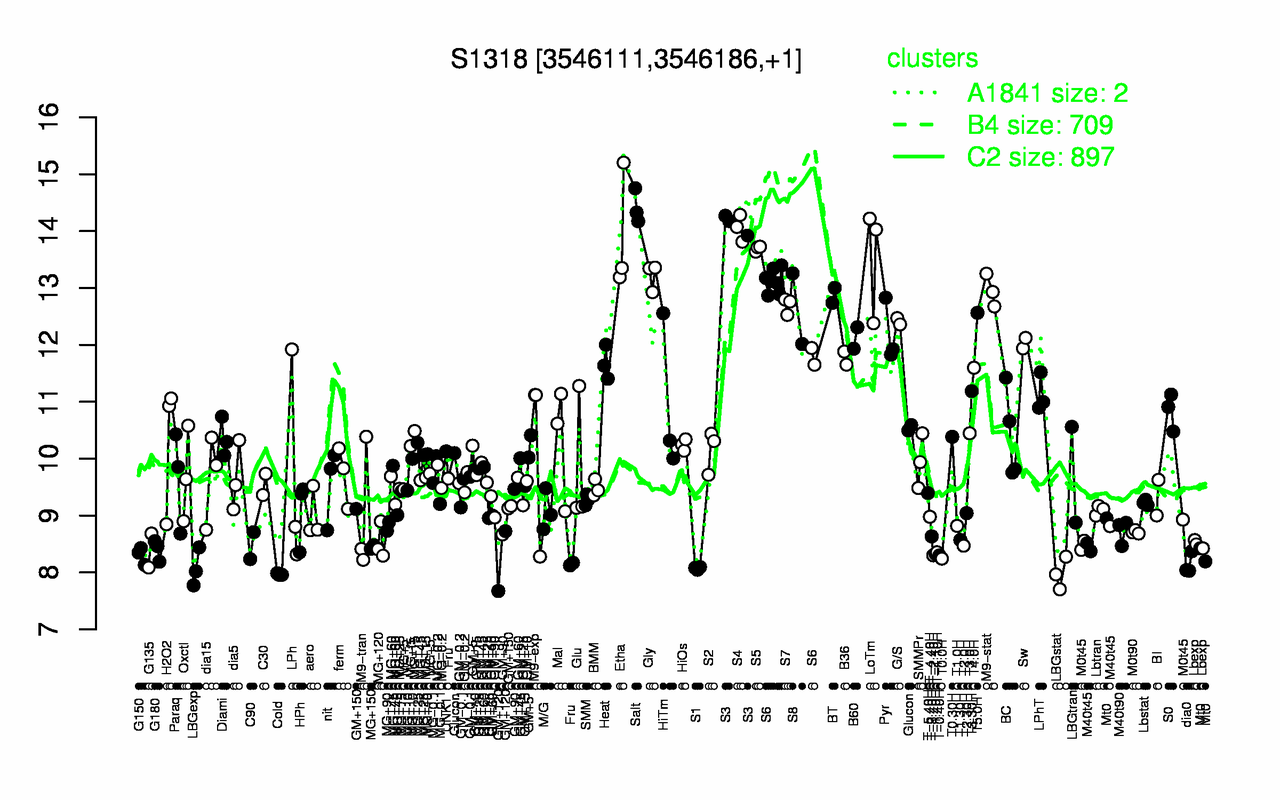
| Salt | S3 | S4 | Etha | S5 | LoTm | Gly | M9-stat | BT | S6 |
| 14.4 | 14.1 | 14.1 | 13.9 | 13.7 | 13.5 | 13.2 | 13 | 12.9 | 12.8 |
| Cold | LBGstat | S1 | LBGexp | dia0 | GM+120 | T0.0H | T-2.40H | T-0.40H | G150 |
| 7.97 | 7.98 | 8.07 | 8.08 | 8.15 | 8.2 | 8.24 | 8.3 | 8.3 | 8.3 |