| Start Page |
|
 |
| Start Page |
|
|
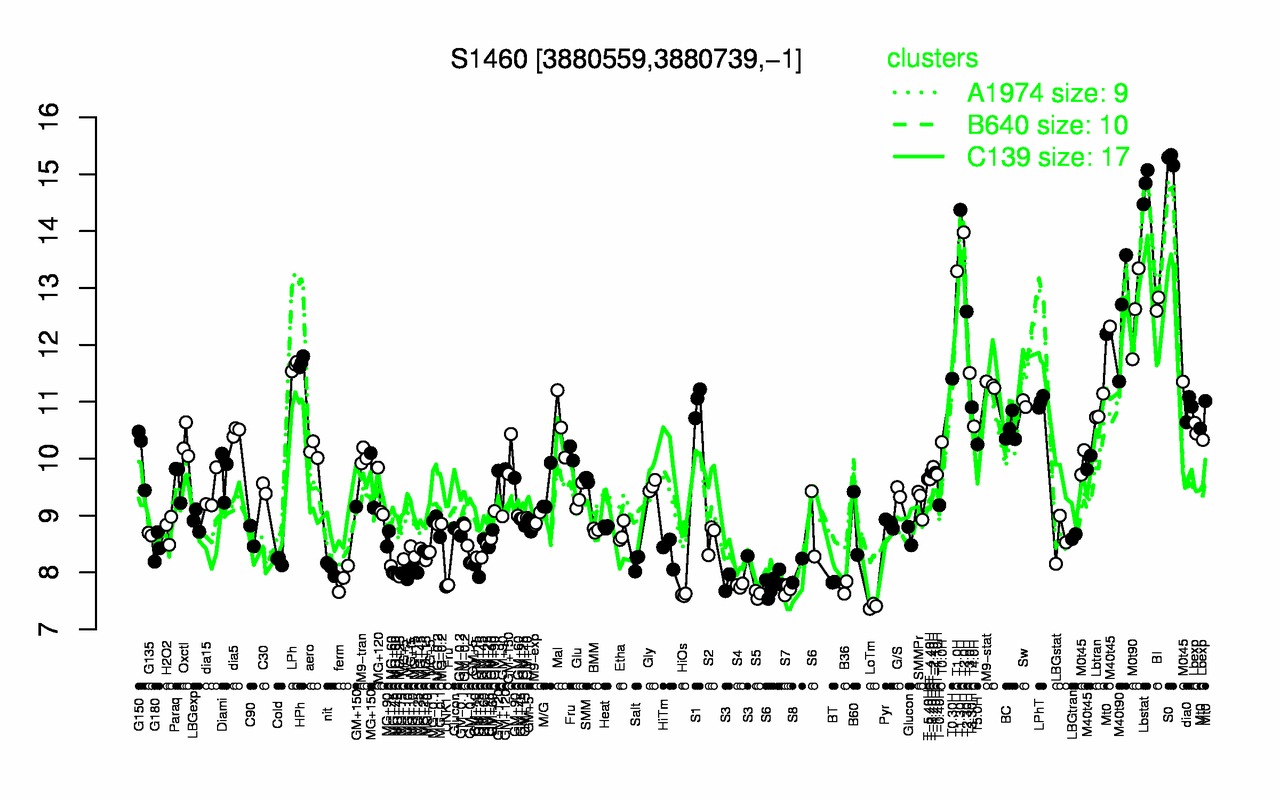
| S0 | Lbstat | T1.30H | T2.0H | T1.0H | BI | T2.30H | M0t90 | M40t90 | HPh |
| 15.3 | 14.8 | 14.4 | 14 | 13.3 | 12.7 | 12.6 | 12.6 | 12.5 | 11.7 |
| LoTm | HiOs | S5 | S7 | B36 | UNK1 | S4 | BT | ferm | S3 |
| 7.41 | 7.61 | 7.61 | 7.69 | 7.74 | 7.75 | 7.77 | 7.83 | 7.89 | 7.98 |