B. subtilis Expression Data Browser
Start Page
B. subtilis Expression Data Browser
Gene/Segment:
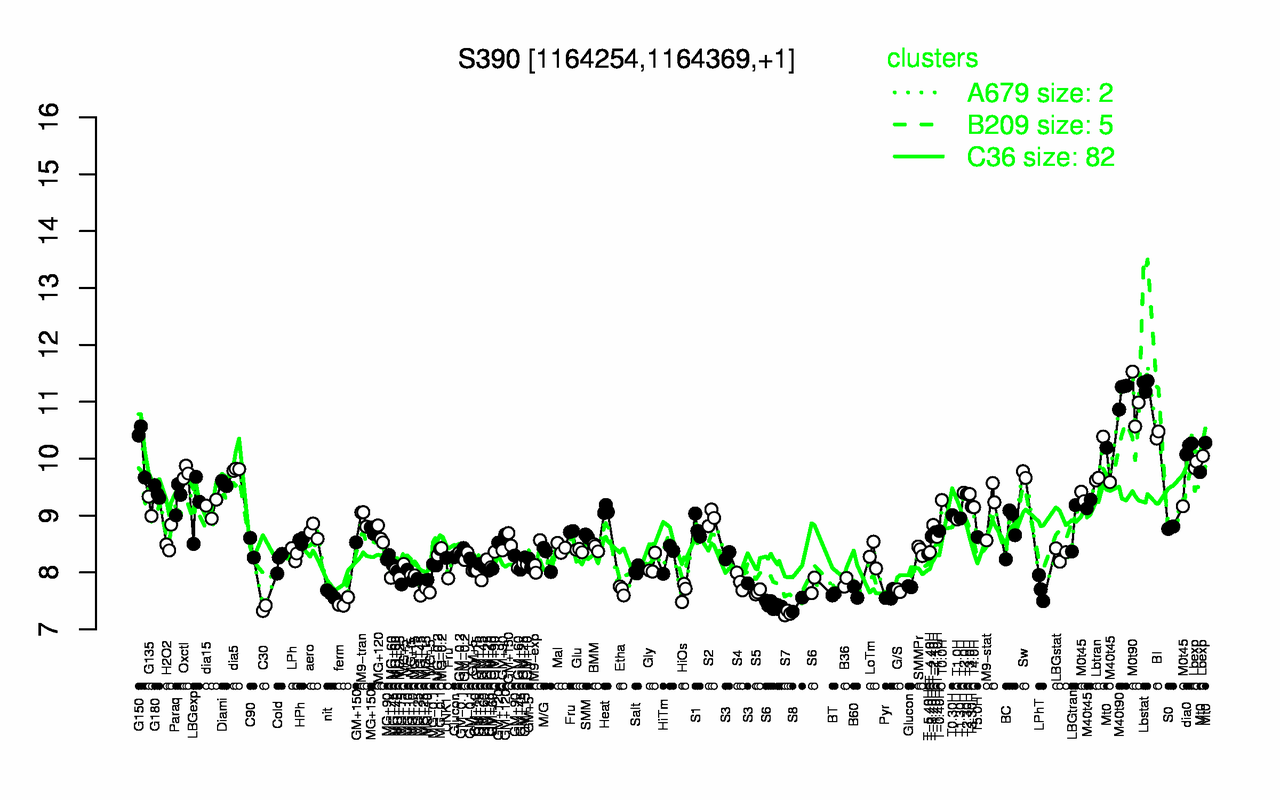
S390
Locus Tag:
new_1164254_1164369
Details about S390
Show/Hide
Highest Expression Conditions
Lbstat
M40t90
M0t90
BI
G150
dia0
Mt0
Lbexp
Lbtran
dia5
11.3
11.1
11
10.4
10.2
10.2
10.1
9.94
9.89
9.81
Lowest Expression Conditions
S7
C30
S8
ferm
S6
Pyr
BT
nit
B60
S5
7.28
7.37
7.43
7.47
7.5
7.6
7.62
7.62
7.65
7.66
Most Positively Correlated Segments
yisS
ykvZ
S220
dctB
gutR
gutB
mmsA
S1526
uxaC
lplC
0.98
0.77
0.75
0.74
0.74
0.74
0.74
0.73
0.72
0.71
Most Negatively Correlated Segments
S1055
safA
S1056
yuzK
coxA
S1259
nadA
proH
proJ
ylmC
-0.74
-0.73
-0.73
-0.72
-0.71
-0.71
-0.7
-0.67
-0.67
-0.66
Expression Profile of Segment S390
Show/Hide
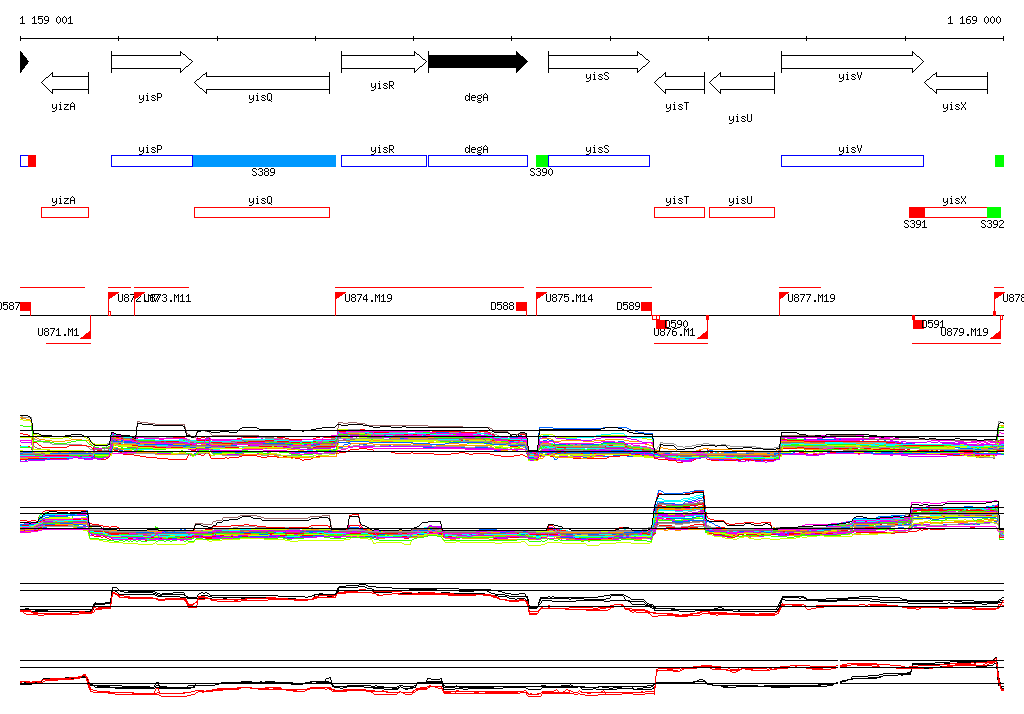
Genomic View of Gene/Segment S390
Show/Hide
(Legend)
Browse Genome Context