B. subtilis Expression Data Browser
Start Page
B. subtilis Expression Data Browser
Gene/Segment:
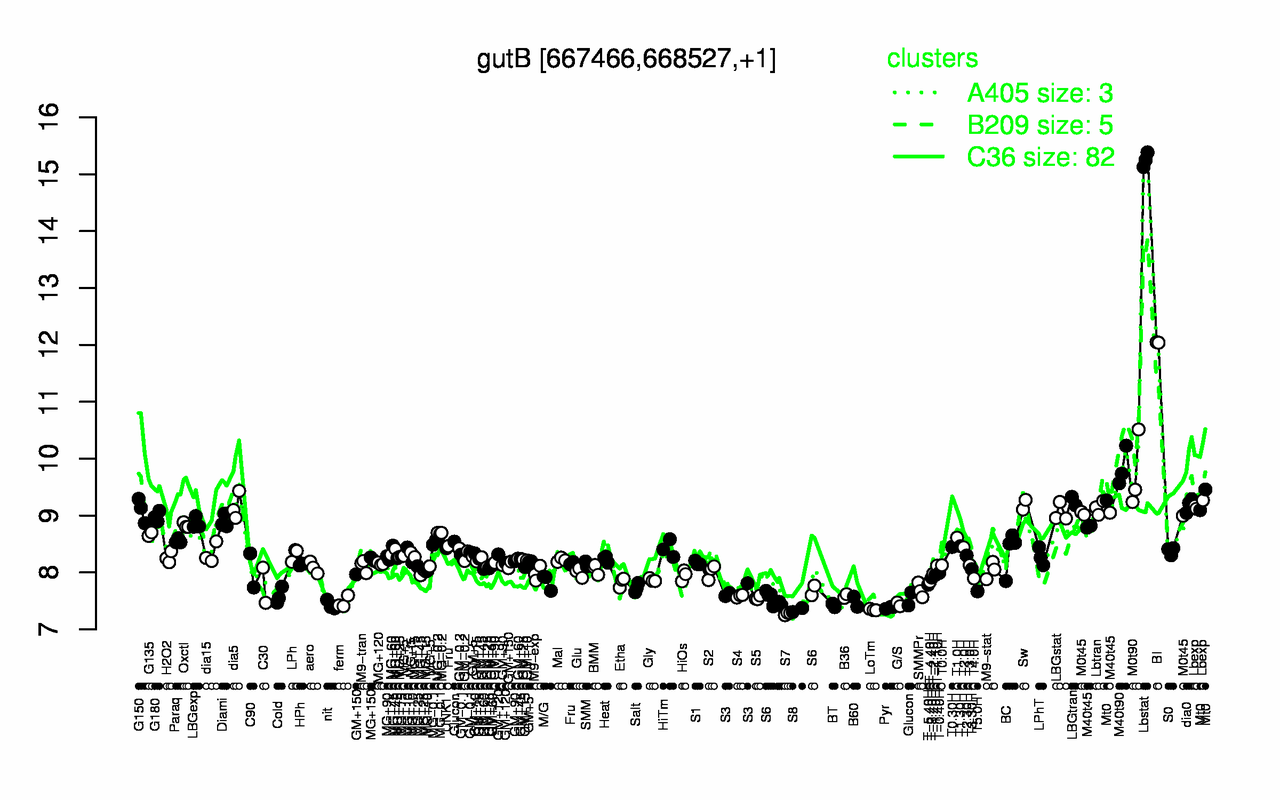
gutB
Locus Tag:
BSU06150
Details about gutB
Show/Hide
Highest Expression Conditions
Lbstat
BI
M40t90
M0t90
Mt0
LBGtran
Sw
Lbexp
dia0
dia5
15.3
12
9.84
9.73
9.27
9.25
9.19
9.19
9.18
9.16
Lowest Expression Conditions
S7
S8
LoTm
Pyr
BT
nit
G/S
ferm
B60
S5
7.28
7.34
7.34
7.38
7.42
7.43
7.44
7.47
7.49
7.55
Most Positively Correlated Segments
S220
gutP
yisS
S390
yclJ
yclK
yngB
ecsB
yvjA
ecsC
0.96
0.92
0.77
0.74
0.67
0.66
0.64
0.63
0.63
0.62
Most Negatively Correlated Segments
safA
S1056
S1055
nadA
proH
proJ
coxA
S909
artP
artQ
-0.61
-0.61
-0.61
-0.58
-0.57
-0.55
-0.55
-0.54
-0.54
-0.53
Expression Profile of Segment gutB
Show/Hide
Annotation of Gene gutB
Show/Hide
function
16.11: Scavenge (Catabolism)
inference
ab initio prediction:AMIGene:2.0
codon_start
1
EC_number
1.1.1.14
transl_table
11
note
Evidence 1a: Function experimentally demonstrated in the studied strain; PubMedId: 12897001; Product type e: enzyme
db_xref
GI:2632928
product
glucitol (sorbitol) dehydrogenase
protein_id
CAB12434.1
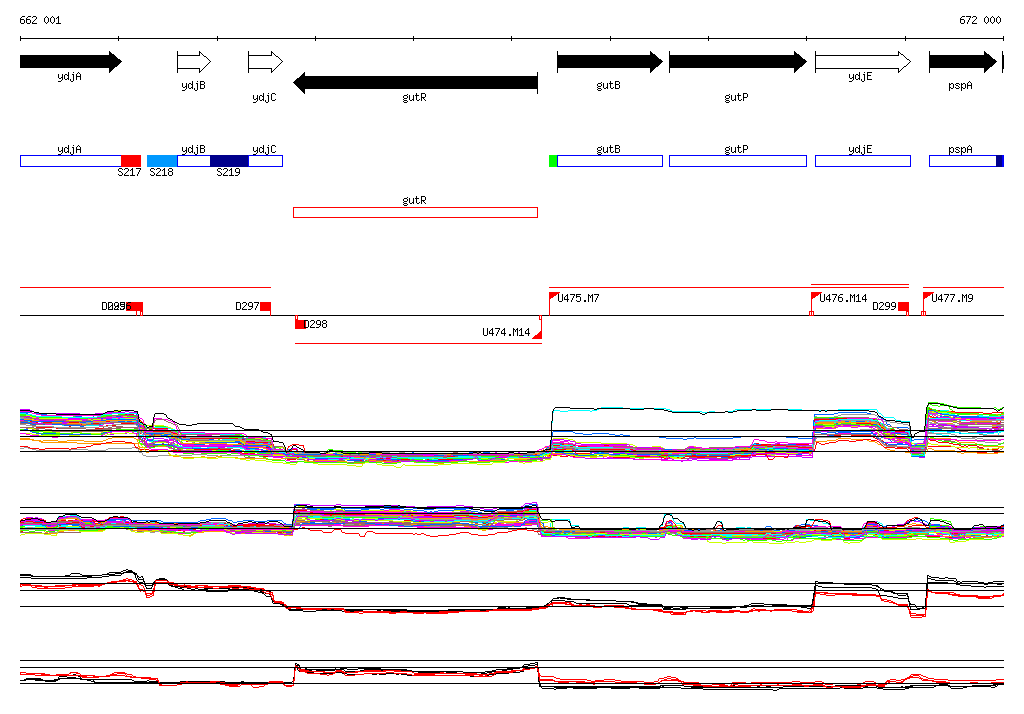
Genomic View of Gene/Segment gutB
Show/Hide
(Legend)
Browse Genome Context