| Start Page |
|
 |
| Start Page |
|
|
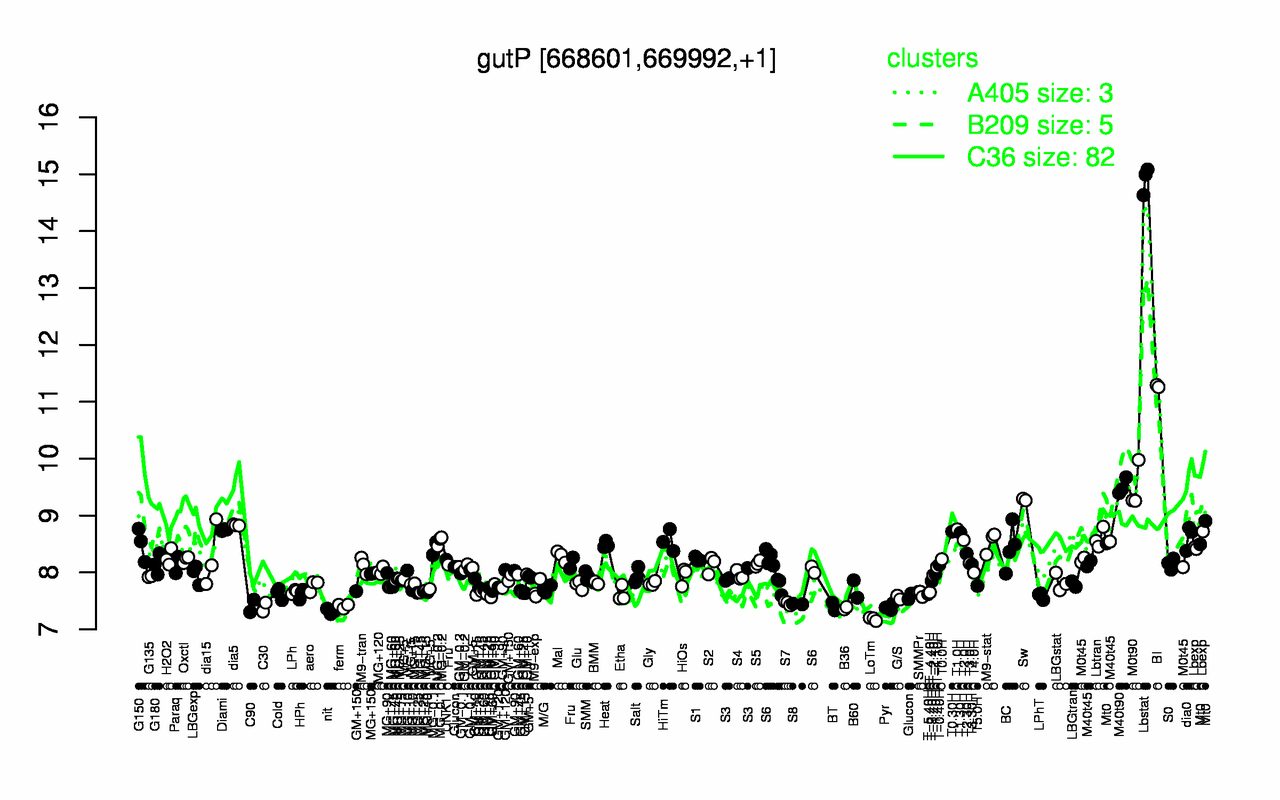
| Lbstat | BI | M40t90 | M0t90 | Sw | dia5 | T1.0H | Diami | T0.30H | T1.30H |
| 14.9 | 11.3 | 9.51 | 9.5 | 9.28 | 8.83 | 8.76 | 8.75 | 8.72 | 8.7 |
| LoTm | nit | B36 | Pyr | C30 | BT | ferm | C90 | S8 | S7 |
| 7.18 | 7.32 | 7.37 | 7.39 | 7.39 | 7.4 | 7.41 | 7.41 | 7.45 | 7.46 |