| Start Page |
|
 |
| Start Page |
|
|
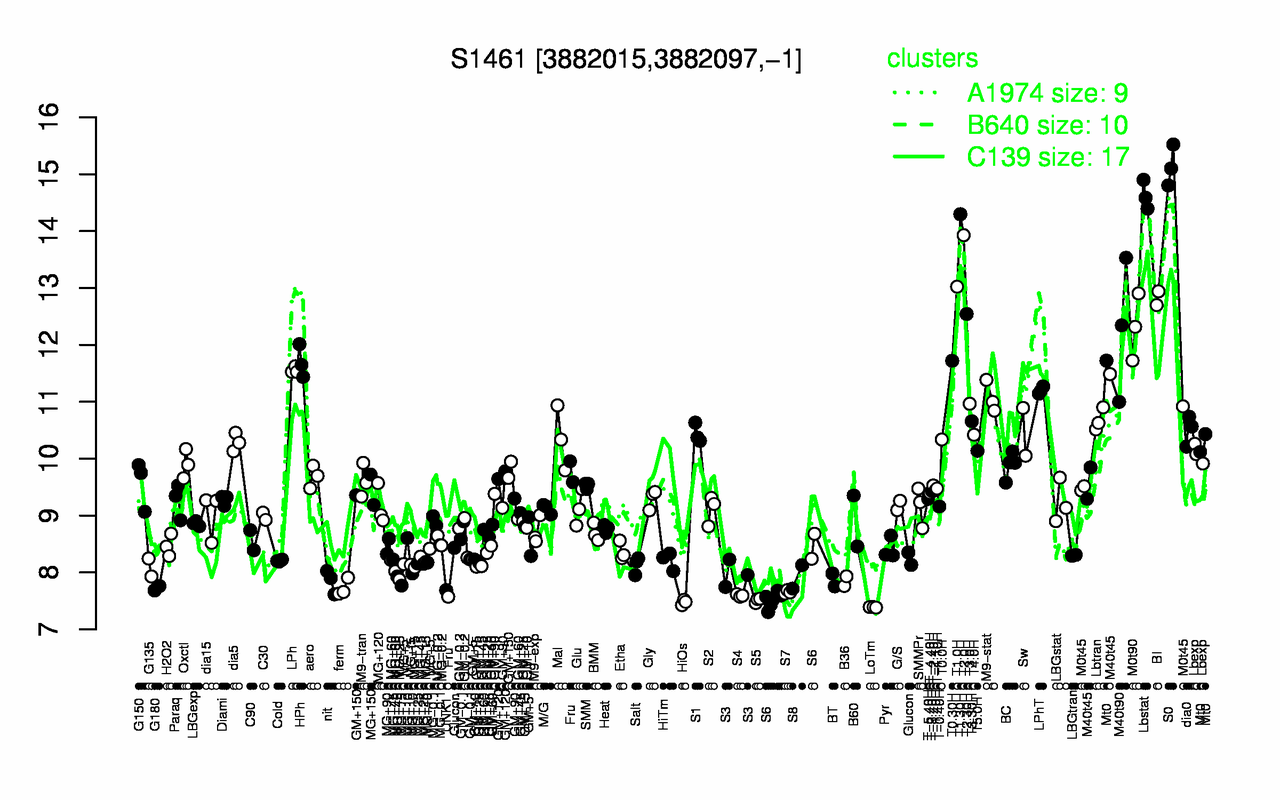
| S0 | Lbstat | T1.30H | T2.0H | T1.0H | BI | T2.30H | M0t90 | M40t90 | T0.30H |
| 15.1 | 14.6 | 14.3 | 13.9 | 13 | 12.8 | 12.5 | 12.3 | 12.3 | 11.7 |
| LoTm | HiOs | S5 | S4 | S7 | UNK1 | G180 | ferm | S6 | B36 |
| 7.39 | 7.48 | 7.51 | 7.6 | 7.66 | 7.69 | 7.73 | 7.73 | 7.74 | 7.85 |