| Start Page |
|
 |
| Start Page |
|
|
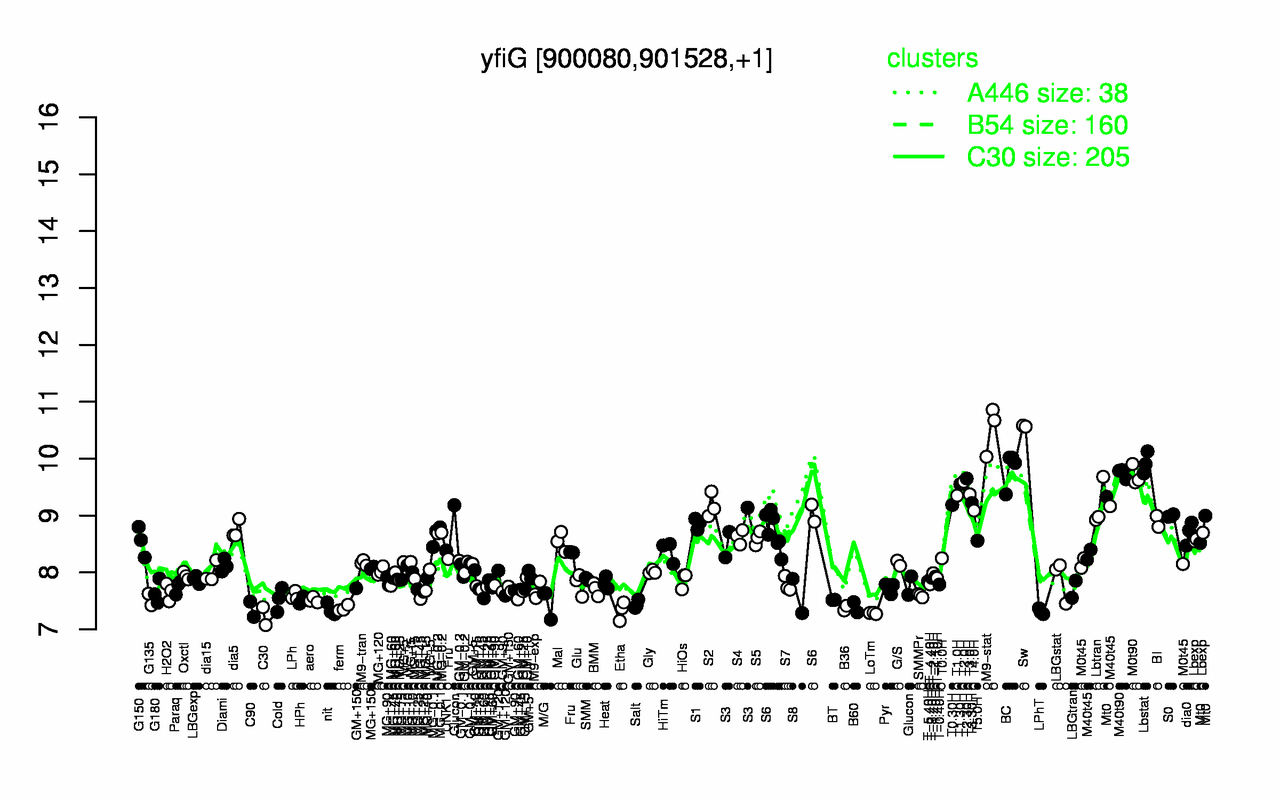
| Sw | M9-stat | Lbstat | BC | M40t90 | M0t90 | T2.30H | T2.0H | T1.30H | T3.0H |
| 10.6 | 10.5 | 9.92 | 9.83 | 9.74 | 9.7 | 9.65 | 9.59 | 9.55 | 9.37 |
| C30 | LoTm | LPhT | Etha | nit | C90 | ferm | B36 | B60 | Salt |
| 7.23 | 7.28 | 7.31 | 7.33 | 7.35 | 7.35 | 7.37 | 7.37 | 7.39 | 7.44 |