| Start Page |
|
 |
| Start Page |
|
|
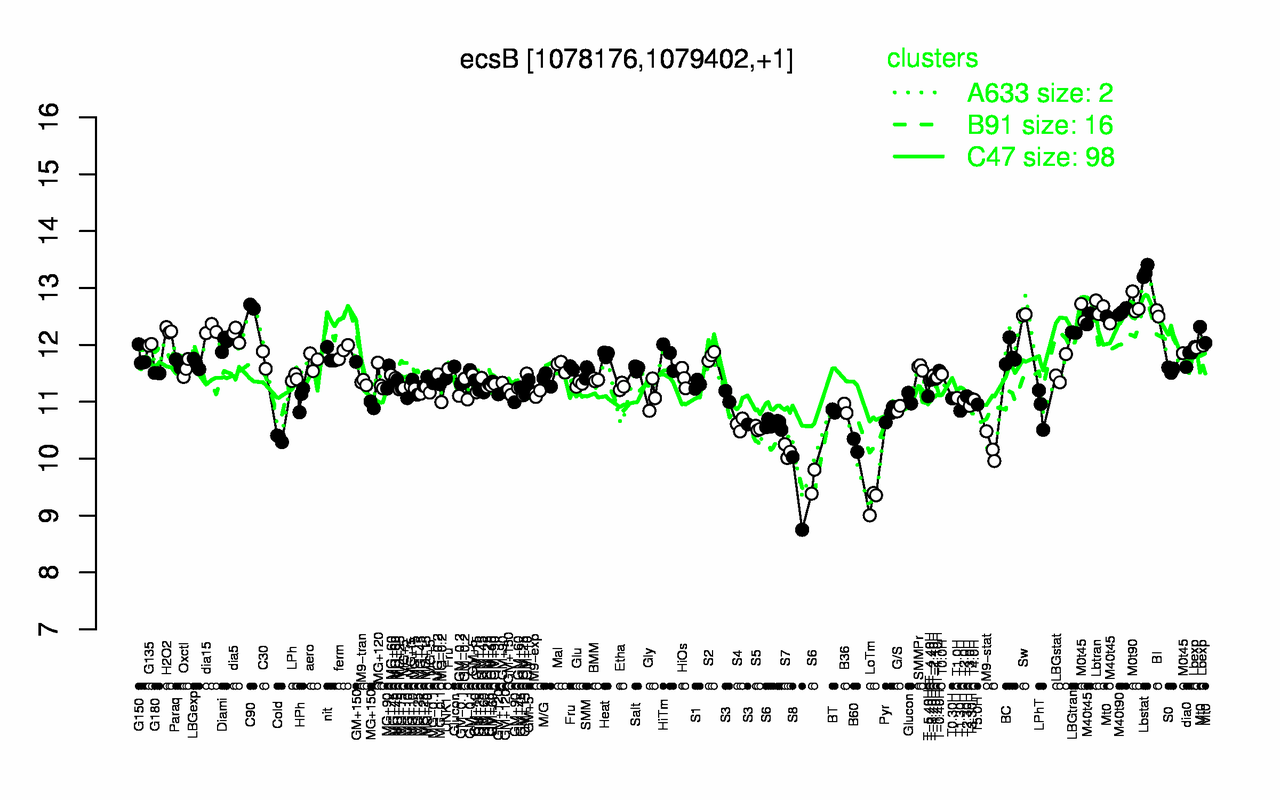
| Lbstat | M0t90 | C90 | Lbtran | M40t90 | BI | Sw | M40t45 | M0t45 | Mt0 |
| 13.3 | 12.7 | 12.7 | 12.7 | 12.6 | 12.6 | 12.5 | 12.4 | 12.3 | 12.3 |
| LoTm | S8 | S7 | M9-stat | B60 | Cold | S6 | S5 | S4 | Pyr |
| 9.25 | 9.39 | 10.1 | 10.2 | 10.2 | 10.4 | 10.4 | 10.5 | 10.6 | 10.8 |