| Start Page |
|
 |
| Start Page |
|
|
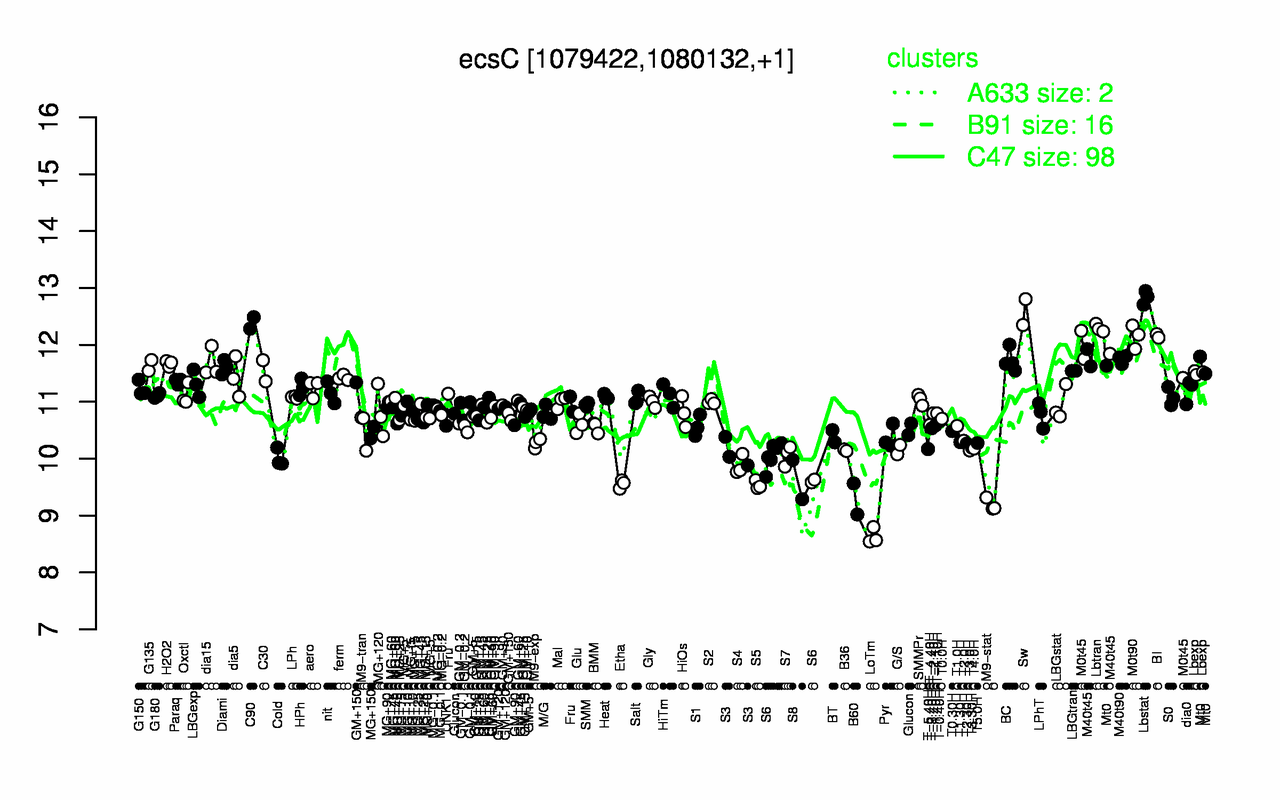
| Lbstat | Sw | C90 | Lbtran | BI | M0t90 | M0t45 | M40t45 | M40t90 | BC |
| 12.8 | 12.6 | 12.4 | 12.3 | 12.2 | 12.1 | 11.8 | 11.8 | 11.7 | 11.7 |
| LoTm | M9-stat | B60 | S5 | Etha | S8 | S4 | S6 | Cold | S7 |
| 8.64 | 9.19 | 9.29 | 9.54 | 9.55 | 9.63 | 9.88 | 9.98 | 10 | 10.1 |