| Start Page |
|
 |
| Start Page |
|
|
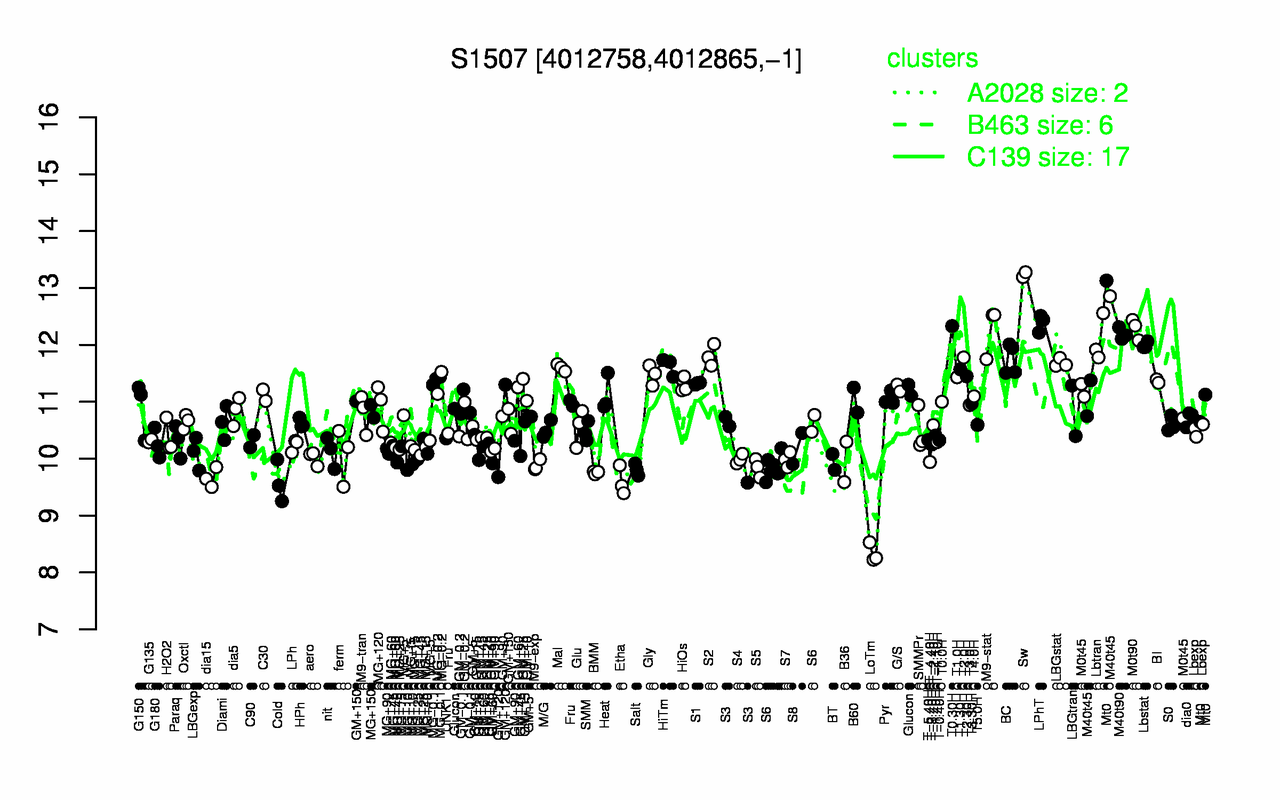
| Sw | LPhT | T0.30H | M0t90 | M9-stat | M40t90 | Lbtran | Lbstat | S2 | T2.0H |
| 13.2 | 12.4 | 12.3 | 12.3 | 12.3 | 12.2 | 12.1 | 12 | 11.8 | 11.8 |
| LoTm | Cold | Etha | dia15 | BMM | Salt | S5 | M9-exp | MG+10 | T-4.40H |
| 8.34 | 9.59 | 9.6 | 9.67 | 9.76 | 9.81 | 9.84 | 9.88 | 9.93 | 9.94 |