| Start Page |
|
 |
| Start Page |
|
|
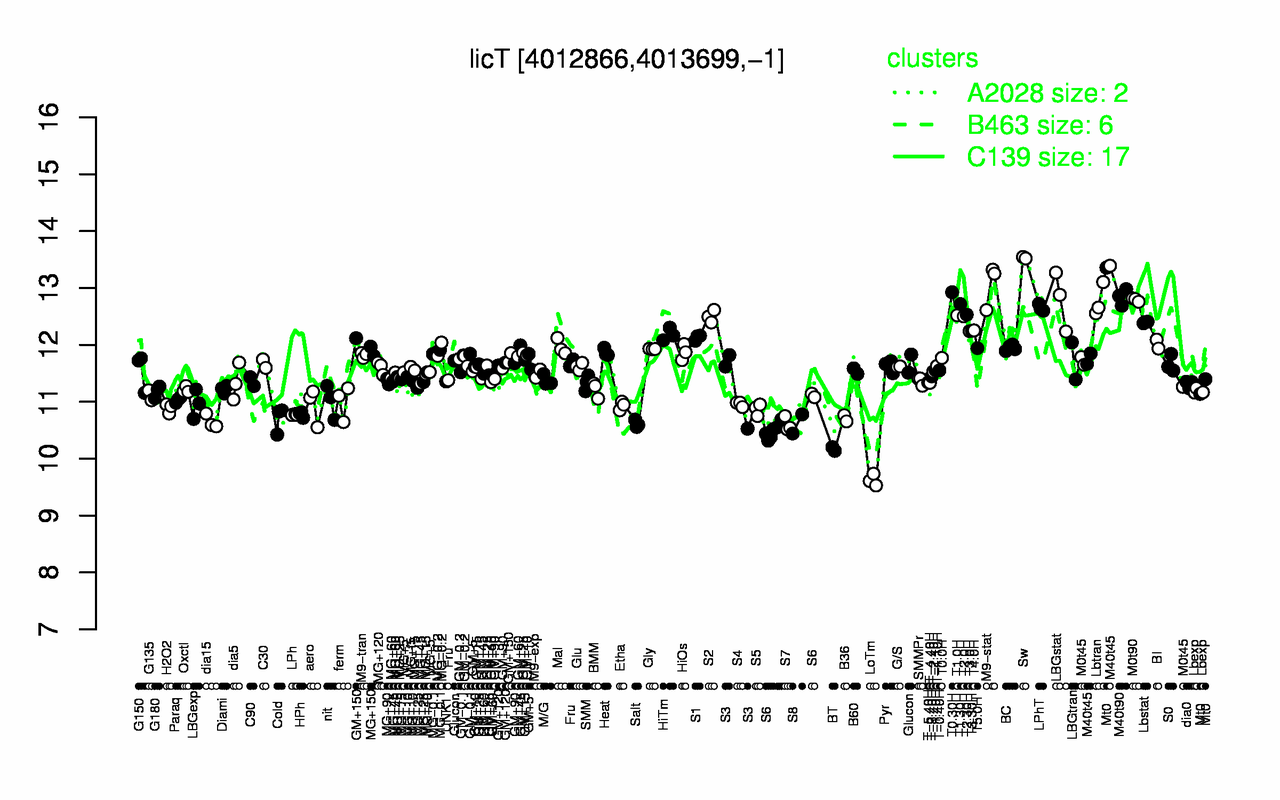
| Sw | M9-stat | T0.30H | M40t90 | LBGstat | M0t90 | Lbtran | T1.30H | LPhT | T2.30H |
| 13.5 | 13.1 | 12.9 | 12.8 | 12.8 | 12.8 | 12.8 | 12.7 | 12.7 | 12.5 |
| LoTm | BT | S7 | S8 | Salt | S6 | dia15 | Cold | B36 | LPh |
| 9.62 | 10.2 | 10.6 | 10.6 | 10.6 | 10.6 | 10.7 | 10.7 | 10.7 | 10.8 |