| Start Page |
|
 |
| Start Page |
|
|
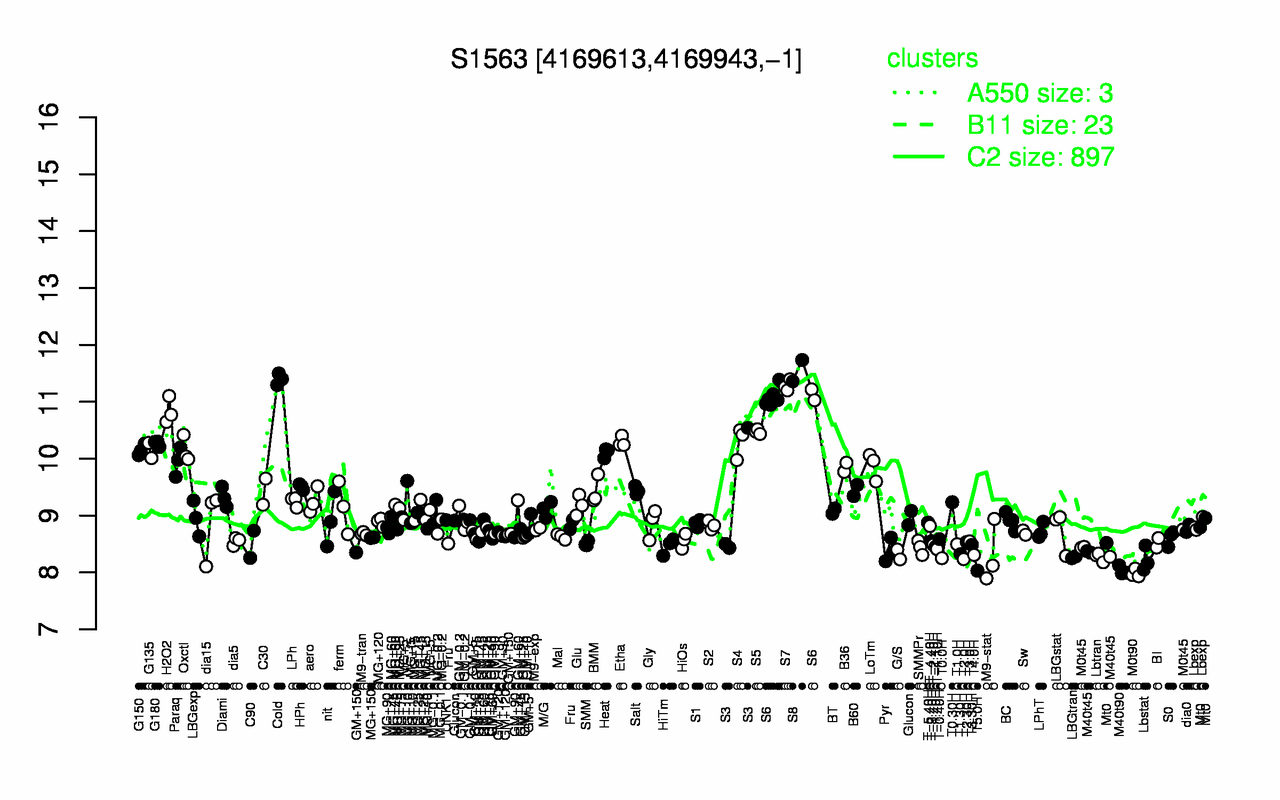
| S8 | Cold | S7 | S6 | H2O2 | S5 | S4 | Etha | G180 | G150 |
| 11.5 | 11.4 | 11.3 | 11.1 | 10.8 | 10.5 | 10.3 | 10.3 | 10.3 | 10.2 |
| M0t90 | T5.0H | M40t90 | Lbstat | T2.0H | T0.0H | LBGtran | Lbtran | T4.0H | G/S |
| 7.99 | 8.03 | 8.03 | 8.23 | 8.23 | 8.25 | 8.27 | 8.27 | 8.31 | 8.32 |