| Start Page |
|
 |
| Start Page |
|
|
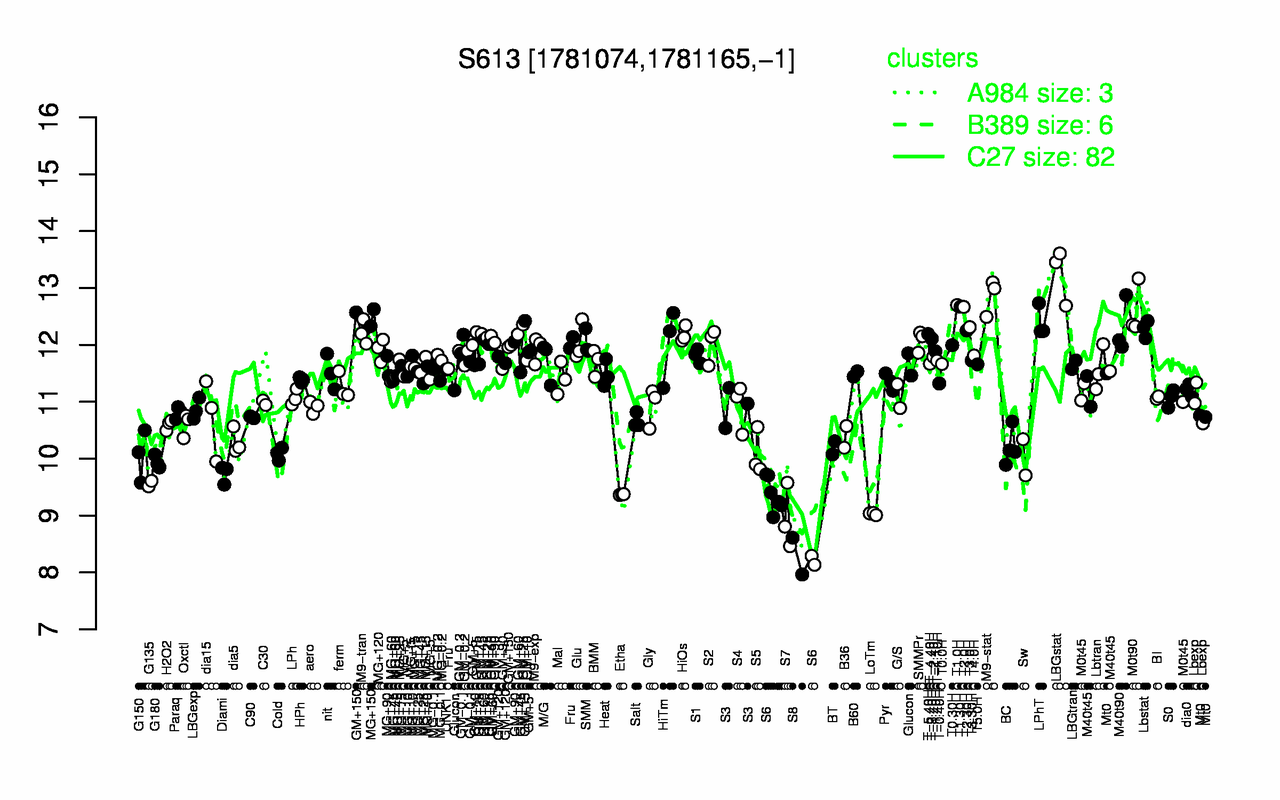
| LBGstat | M9-stat | T1.0H | T1.30H | T2.0H | M0t90 | MG+150 | LPhT | T3.0H | M40t90 |
| 13.2 | 12.9 | 12.7 | 12.7 | 12.7 | 12.6 | 12.5 | 12.4 | 12.3 | 12.3 |
| S8 | S7 | LoTm | S6 | Etha | G135 | Diami | G180 | Sw | G150 |
| 8.29 | 8.95 | 9.03 | 9.1 | 9.37 | 9.56 | 9.73 | 9.94 | 10 | 10.1 |