| Start Page |
|
 |
| Start Page |
|
|
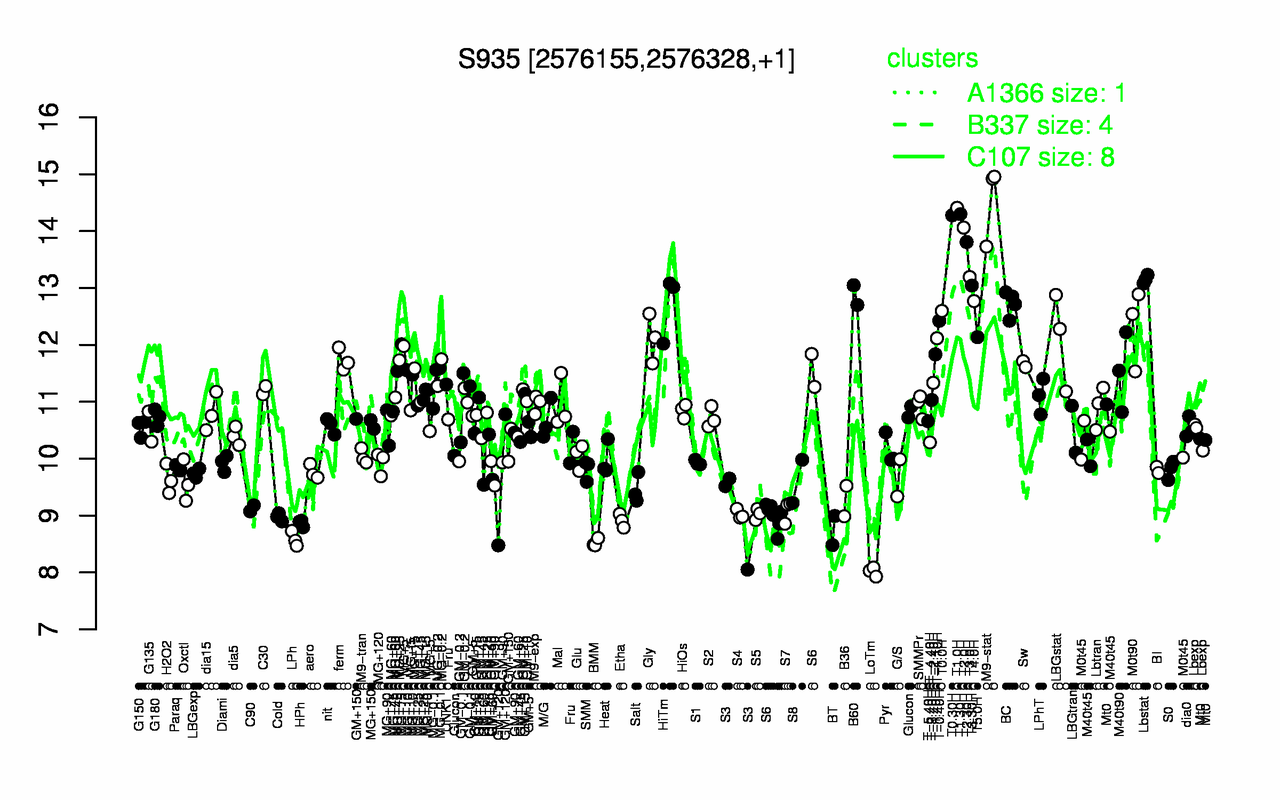
| M9-stat | T1.0H | T1.30H | T0.30H | T2.0H | T2.30H | T3.0H | Lbstat | T3.30H | B60 |
| 14.5 | 14.4 | 14.3 | 14.3 | 14.1 | 13.8 | 13.2 | 13.2 | 13 | 12.9 |
| LoTm | BMM | LPh | BT | HPh | Etha | Cold | S4 | S5 | S3 |
| 8.01 | 8.52 | 8.59 | 8.74 | 8.86 | 8.91 | 8.97 | 9.02 | 9.03 | 9.07 |