| Start Page |
|
 |
| Start Page |
|
|
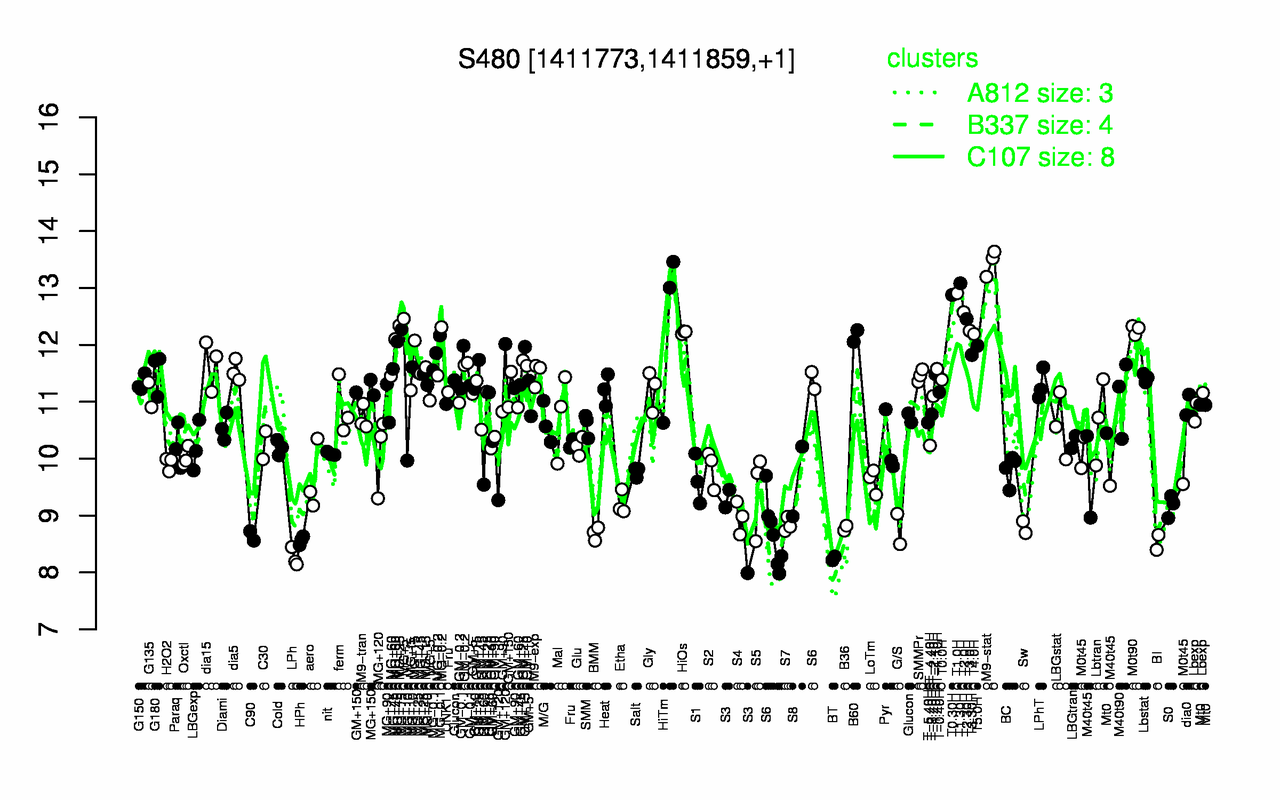
| M9-stat | T1.30H | T1.0H | T0.30H | T2.0H | T2.30H | HiTm | M0t90 | T3.0H | HiOs |
| 13.5 | 13.1 | 12.9 | 12.9 | 12.6 | 12.5 | 12.4 | 12.3 | 12.2 | 12.2 |
| BT | LPh | BI | HPh | C90 | BMM | G/S | B36 | Sw | S7 |
| 8.25 | 8.26 | 8.53 | 8.56 | 8.64 | 8.68 | 8.76 | 8.78 | 8.8 | 8.84 |