| Start Page |
|
 |
| Start Page |
|
|
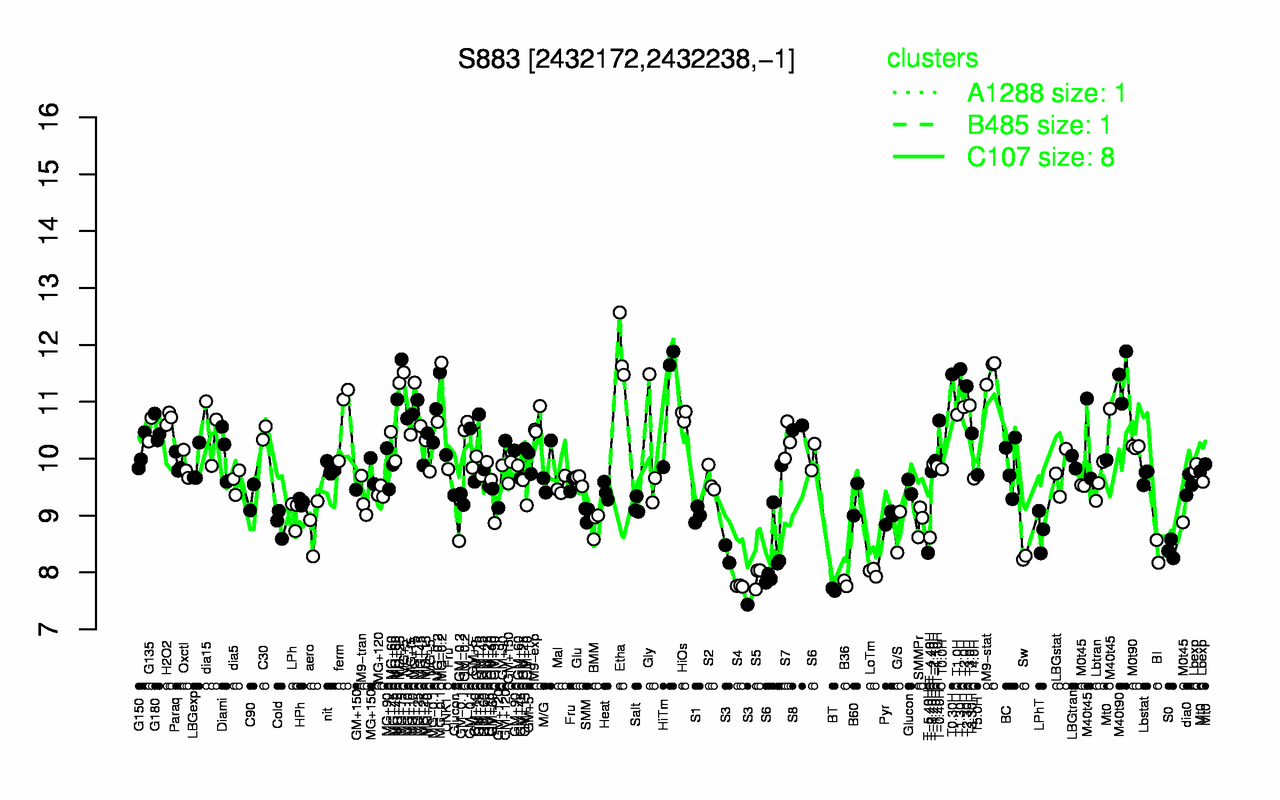
| Etha | T1.30H | M9-stat | T0.30H | M40t90 | T2.30H | MG-0.2 | MG+15 | HiTm | T3.0H |
| 11.9 | 11.6 | 11.5 | 11.5 | 11.4 | 11.3 | 11.2 | 11.1 | 11.1 | 10.9 |
| BT | S4 | B36 | S5 | LoTm | S3 | Sw | T-5.40H | BI | S0 |
| 7.7 | 7.76 | 7.81 | 7.92 | 8.01 | 8.03 | 8.26 | 8.34 | 8.37 | 8.4 |