| Start Page |
|
 |
| Start Page |
|
|
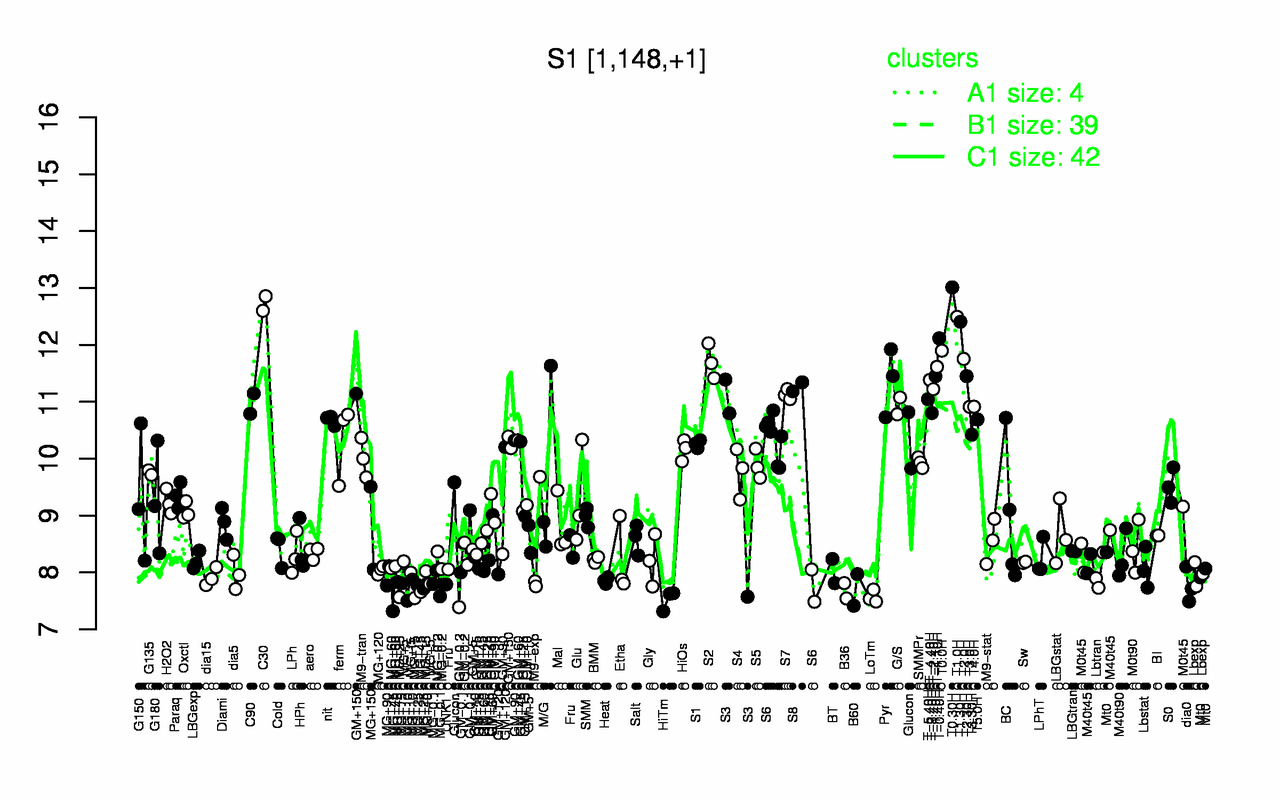
| T0.30H | C30 | T1.0H | T1.30H | T-0.40H | T0.0H | T2.0H | S2 | T-1.10H | T2.30H |
| 13 | 12.7 | 12.5 | 12.4 | 12.1 | 11.9 | 11.8 | 11.7 | 11.6 | 11.5 |
| HiTm | LoTm | MG+45 | B36 | MG+25 | B60 | MG+10 | dia0 | UNK1 | MG+15 |
| 7.53 | 7.57 | 7.6 | 7.68 | 7.69 | 7.69 | 7.73 | 7.77 | 7.79 | 7.79 |