| Start Page |
|
 |
| Start Page |
|
|
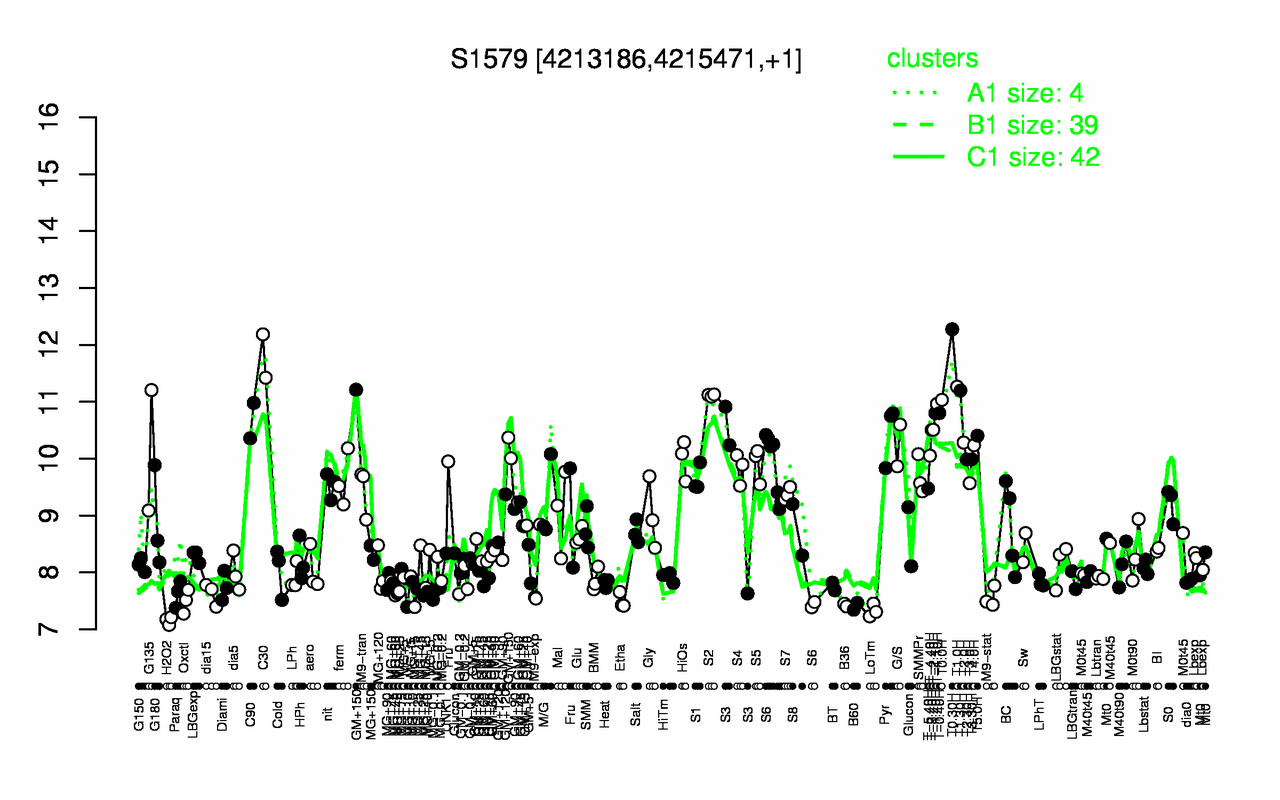
| T0.30H | C30 | T1.0H | T1.30H | S2 | T0.0H | T-1.10H | T-0.40H | T-1.40H | C90 |
| 12.3 | 11.8 | 11.3 | 11.2 | 11.1 | 11 | 11 | 10.8 | 10.8 | 10.7 |
| H2O2 | LoTm | B60 | B36 | Oxctl | Etha | M9-stat | dia15 | MG+10 | Paraq |
| 7.16 | 7.33 | 7.41 | 7.43 | 7.49 | 7.5 | 7.56 | 7.63 | 7.63 | 7.63 |