| Start Page |
|
 |
| Start Page |
|
|
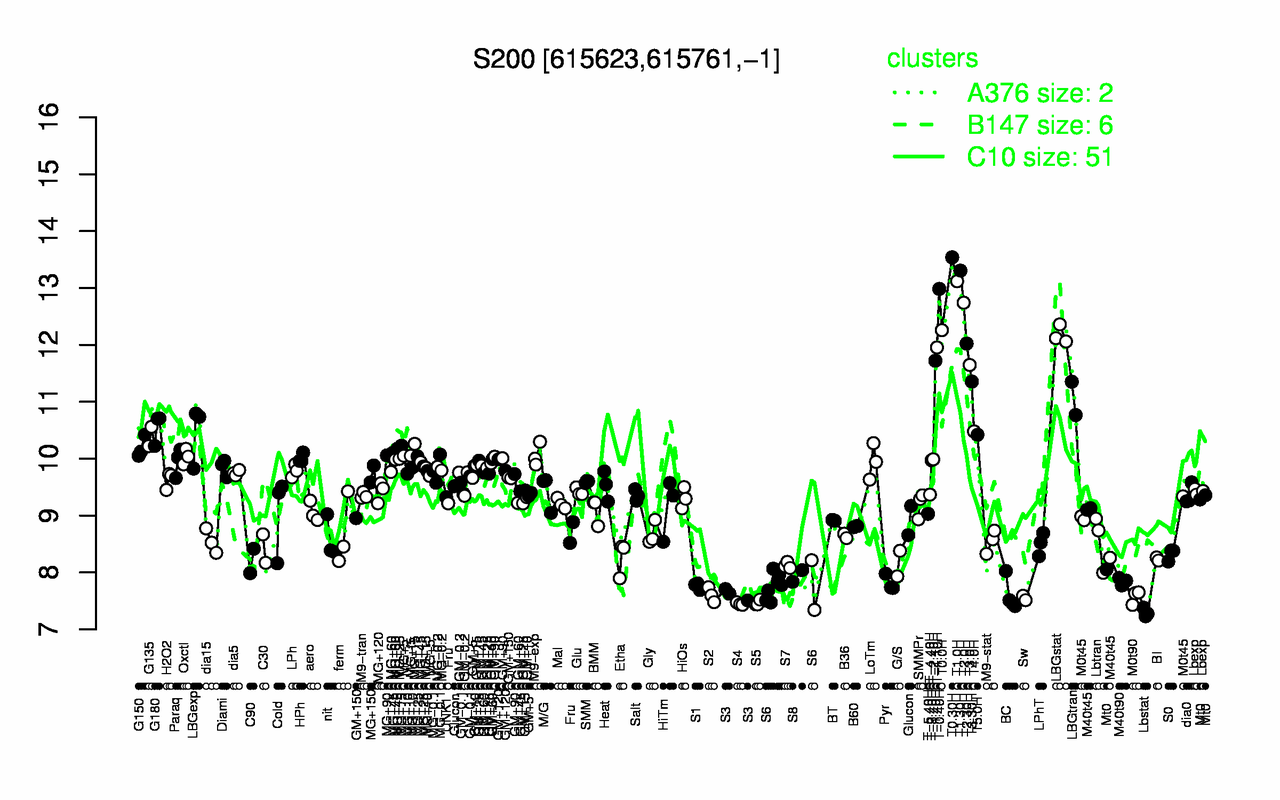
| T0.30H | T1.30H | T1.0H | T-0.40H | T2.0H | T0.0H | LBGstat | T2.30H | T-1.10H | T-1.40H |
| 13.5 | 13.3 | 13.1 | 13 | 12.7 | 12.3 | 12.2 | 12 | 12 | 11.7 |
| Lbstat | S4 | S5 | Sw | M0t90 | BC | S2 | S3 | S6 | S1 |
| 7.3 | 7.45 | 7.47 | 7.55 | 7.57 | 7.6 | 7.61 | 7.61 | 7.76 | 7.76 |