| Start Page |
|
 |
| Start Page |
|
|
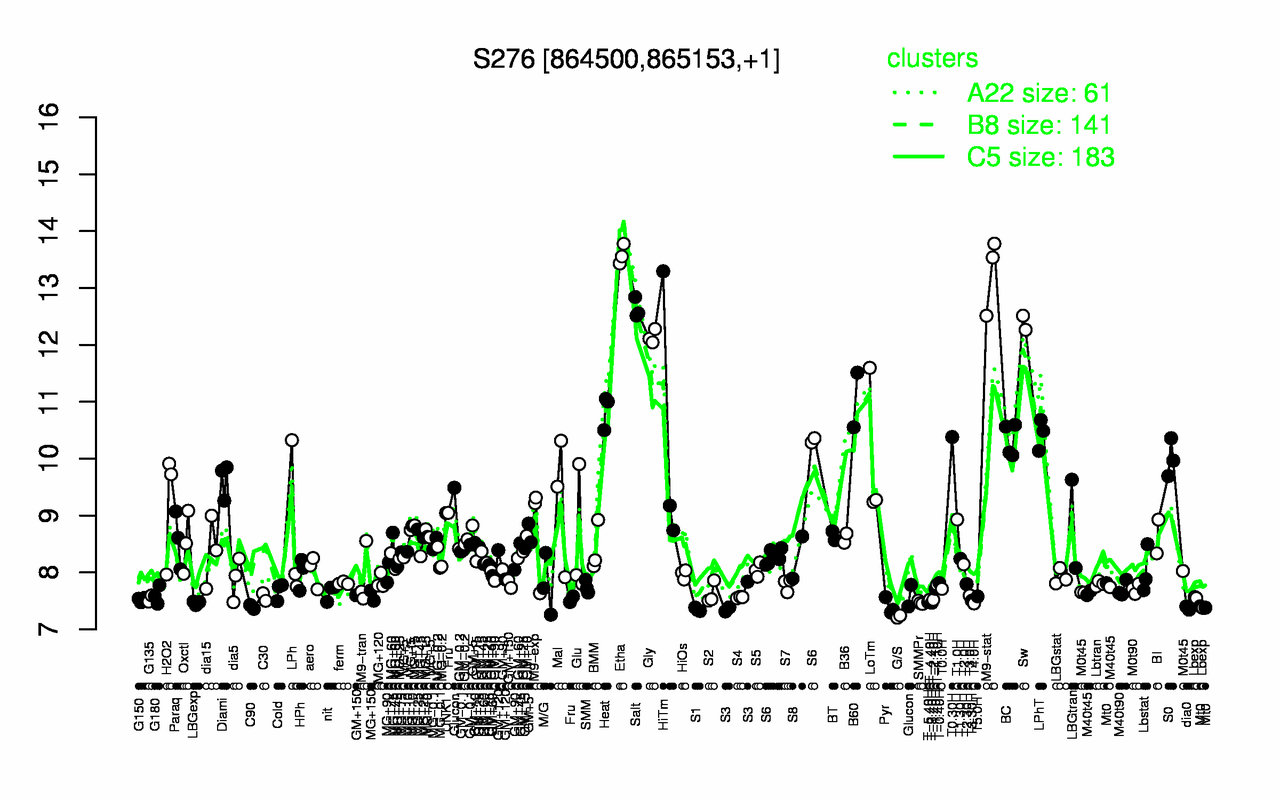
| Etha | M9-stat | Salt | Sw | Gly | B60 | Heat | LPhT | HiTm | T0.30H |
| 13.6 | 13.3 | 12.6 | 12.4 | 12.1 | 11 | 10.9 | 10.4 | 10.4 | 10.4 |
| G/S | S1 | dia0 | C90 | Pyr | T4.0H | LBGexp | T-3.40H | SMMPr | T-5.40H |
| 7.22 | 7.35 | 7.38 | 7.39 | 7.4 | 7.46 | 7.47 | 7.47 | 7.47 | 7.48 |