| Start Page |
|
 |
| Start Page |
|
|
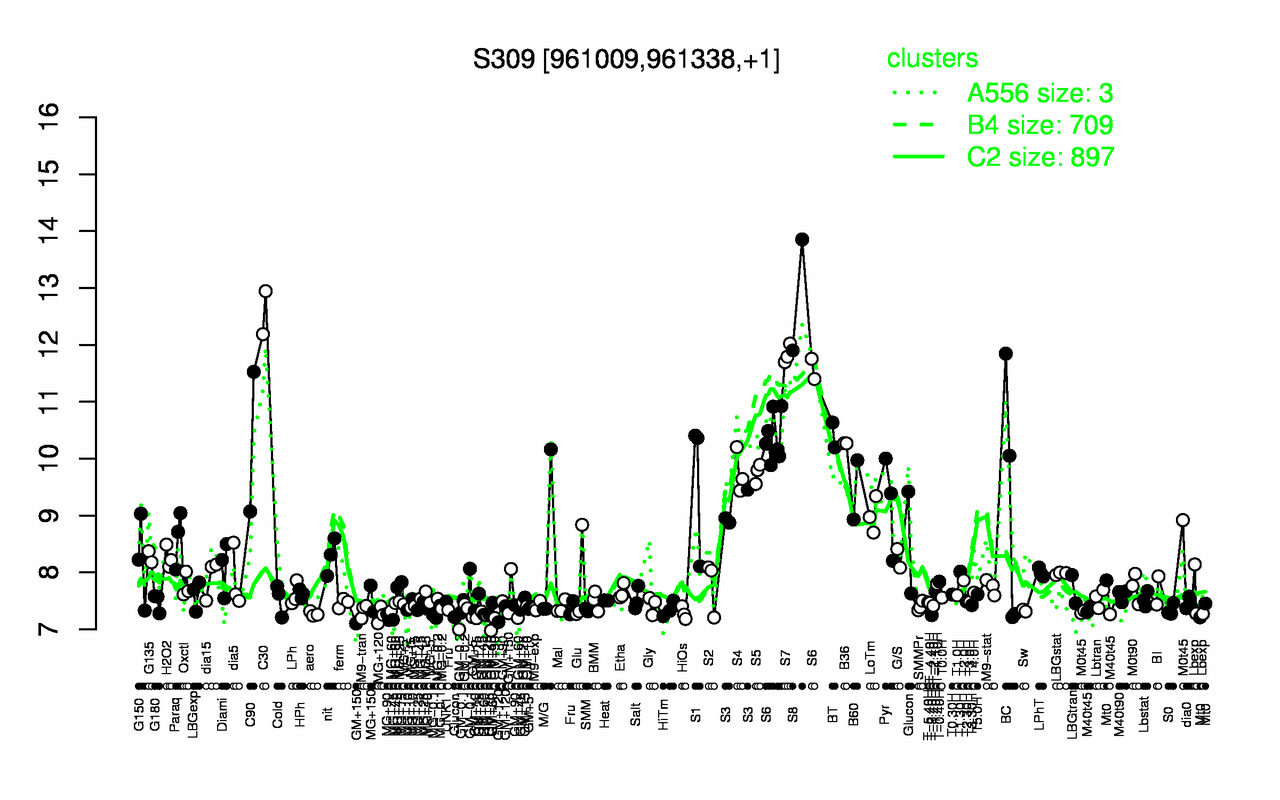
| S8 | C30 | S7 | S6 | BT | C90 | B36 | S4 | S5 | S1 |
| 12.9 | 12.6 | 11.8 | 10.6 | 10.4 | 10.3 | 10.3 | 9.76 | 9.75 | 9.62 |
| GM+45 | MG+90 | T-3.40H | MG+120 | GM+120 | GM-0.2 | aero | HiOs | MG-0.1 | GM+60 |
| 7.21 | 7.22 | 7.25 | 7.25 | 7.27 | 7.27 | 7.27 | 7.28 | 7.29 | 7.31 |