| Start Page |
|
 |
| Start Page |
|
|
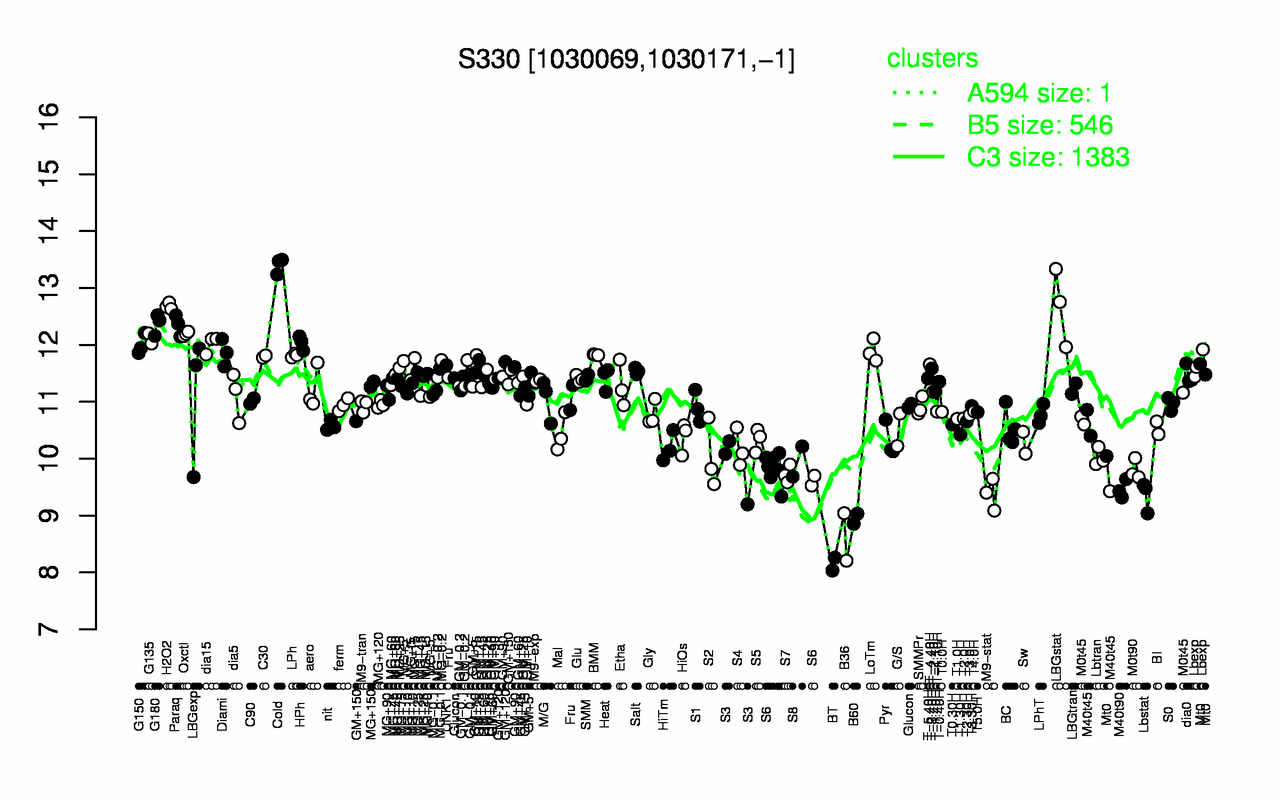
| Cold | LBGstat | H2O2 | G180 | Paraq | Oxctl | G135 | HPh | dia15 | G150 |
| 13.4 | 12.7 | 12.7 | 12.4 | 12.3 | 12.2 | 12.1 | 12 | 12 | 12 |
| BT | B36 | B60 | Lbstat | M9-stat | M40t90 | S7 | S6 | M0t90 | S3 |
| 8.15 | 8.62 | 8.94 | 9.35 | 9.38 | 9.46 | 9.73 | 9.78 | 9.8 | 9.86 |