| Start Page |
|
 |
| Start Page |
|
|
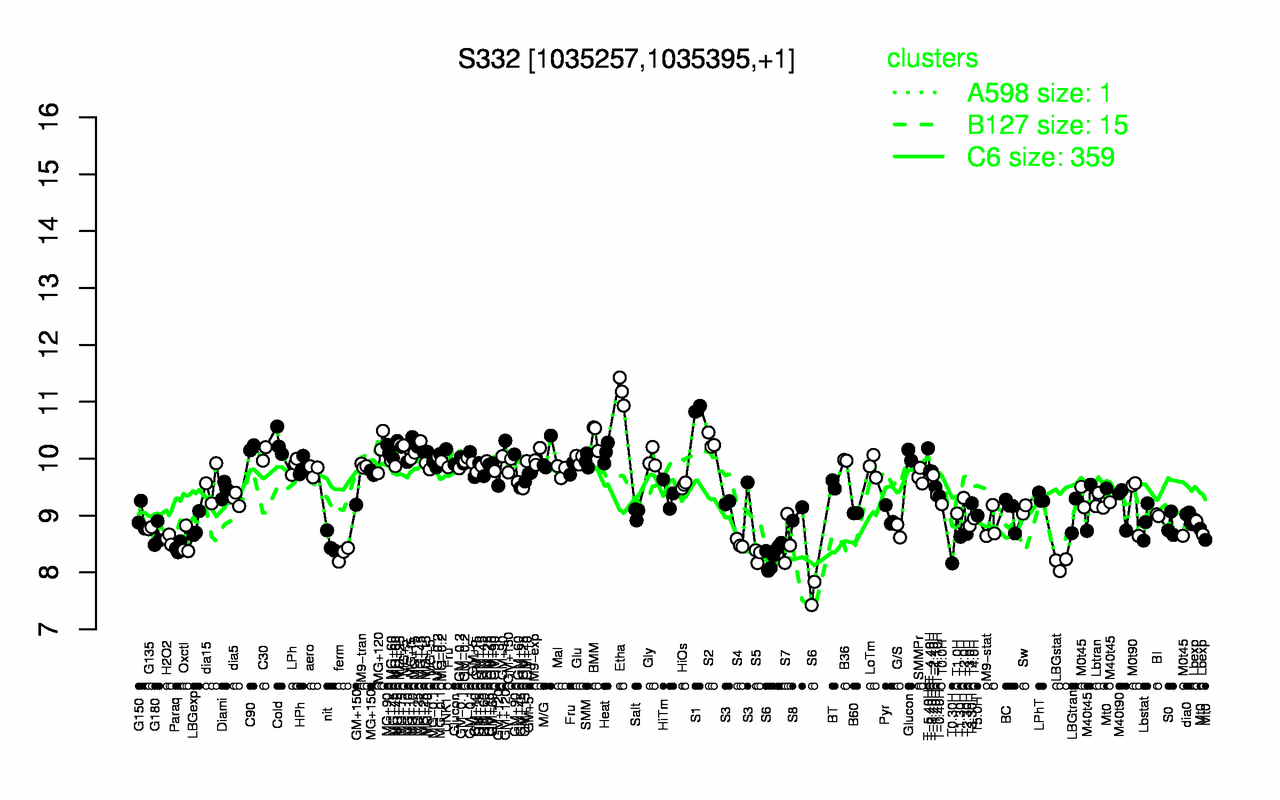
| Etha | S1 | BMM | S2 | Cold | MG+45 | MG+25 | C90 | T-5.40H | MG+90 |
| 11.2 | 10.9 | 10.4 | 10.3 | 10.3 | 10.2 | 10.2 | 10.2 | 10.2 | 10.2 |
| LBGstat | T0.30H | S6 | S5 | ferm | Paraq | S4 | nit | Oxctl | S7 |
| 8.16 | 8.16 | 8.16 | 8.3 | 8.33 | 8.44 | 8.51 | 8.52 | 8.53 | 8.56 |