B. subtilis Expression Data Browser
Start Page
B. subtilis Expression Data Browser
Gene/Segment:
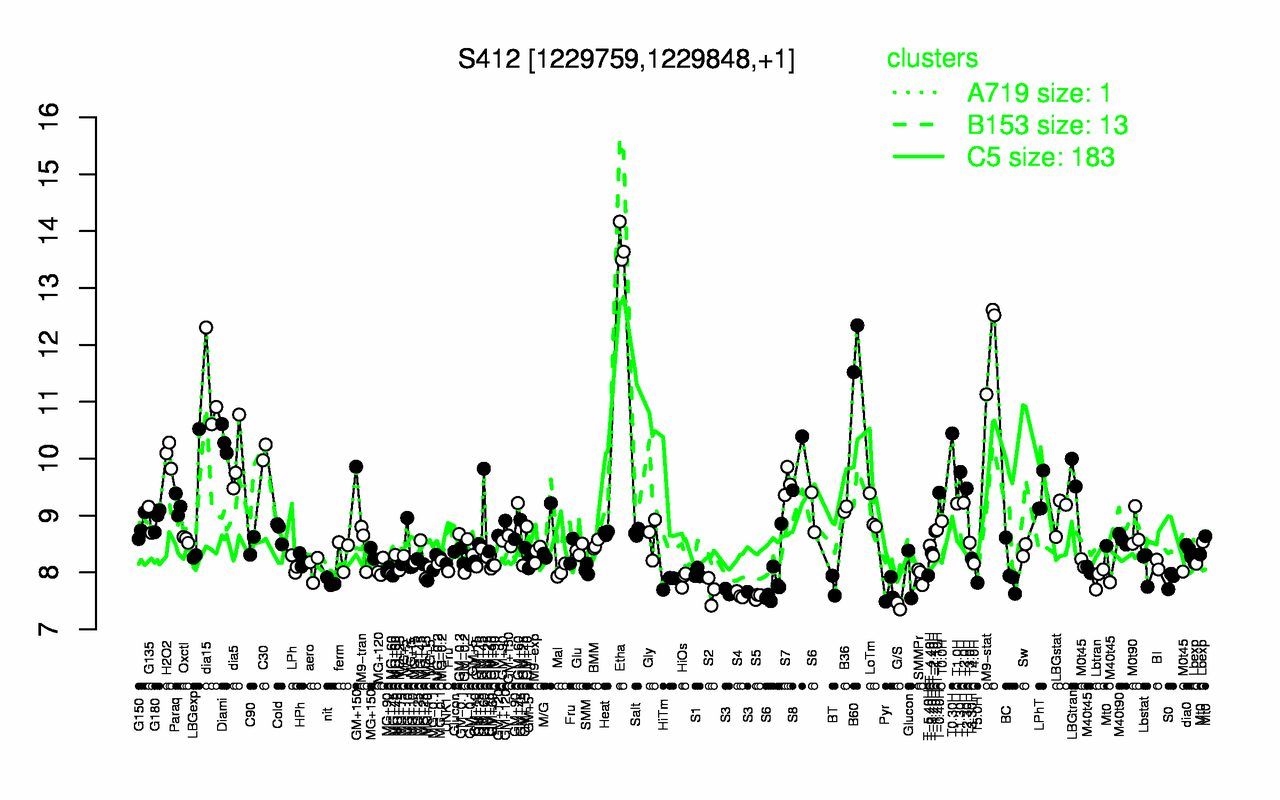
S412
Locus Tag:
new_1229759_1229848
Details about S412
Show/Hide
Highest Expression Conditions
Etha
M9-stat
B60
dia15
T0.30H
Diami
C30
H2O2
dia5
S8
13.8
12.1
11.9
11.3
10.4
10.3
10.1
10.1
10
9.92
Lowest Expression Conditions
G/S
S5
S4
Pyr
S3
S2
BT
T5.0H
nit
HiTm
7.41
7.57
7.61
7.65
7.66
7.67
7.77
7.82
7.83
7.83
Most Positively Correlated Segments
S414
S1468
S1116
S1363
S324
S1319
S1417
yyaO
S528
ywcH
0.79
0.77
0.74
0.73
0.7
0.69
0.68
0.66
0.65
0.65
Most Negatively Correlated Segments
yloV
yopR
ywjI
yfjC
yuxO
murAB
S52
rpoC
yfjB
ndoA
-0.55
-0.5
-0.5
-0.47
-0.47
-0.47
-0.47
-0.47
-0.45
-0.45
Expression Profile of Segment S412
Show/Hide
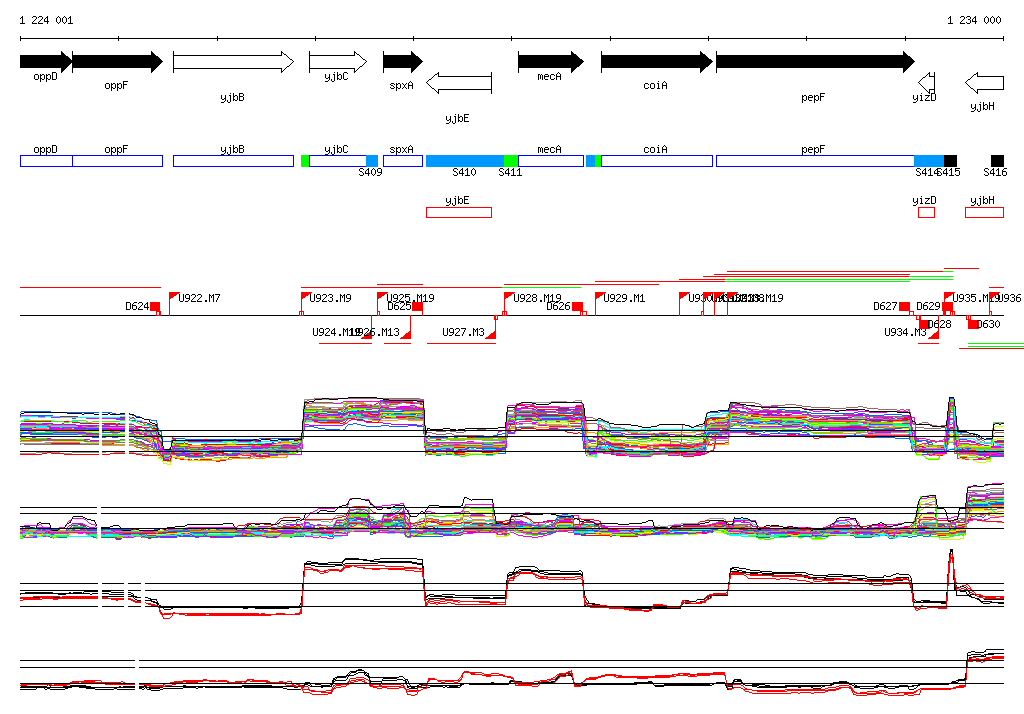
Genomic View of Gene/Segment S412
Show/Hide
(Legend)
Browse Genome Context