| Start Page |
|
 |
| Start Page |
|
|
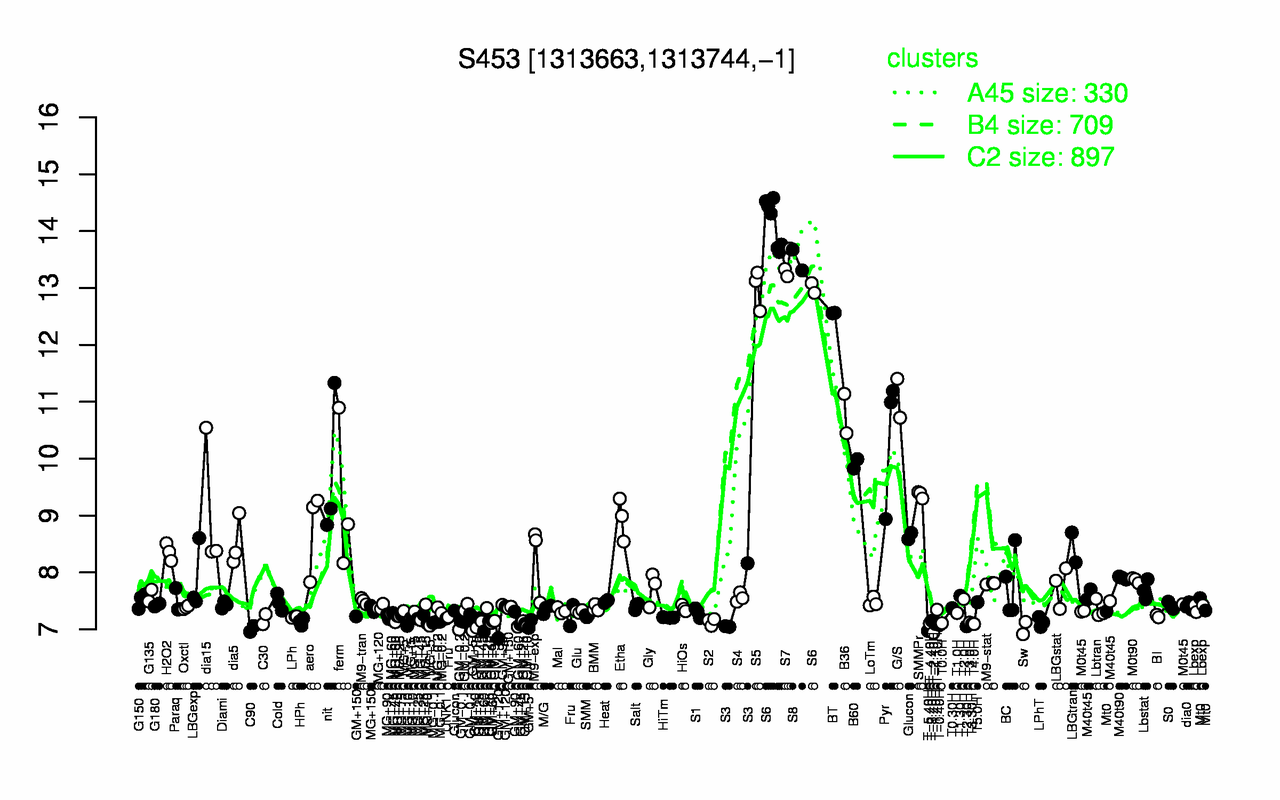
| S6 | S8 | S7 | S5 | BT | G/S | B36 | Pyr | B60 | nit |
| 13.9 | 13.5 | 13.4 | 13 | 12.6 | 11.1 | 10.8 | 10.4 | 9.91 | 9.76 |
| T-2.40H | T-5.40H | C90 | Sw | GM+60 | T2.30H | GM+5 | T-0.40H | GM+10 | GM+15 |
| 6.94 | 6.97 | 7.01 | 7.02 | 7.05 | 7.05 | 7.05 | 7.08 | 7.09 | 7.09 |