| Start Page |
|
 |
| Start Page |
|
|
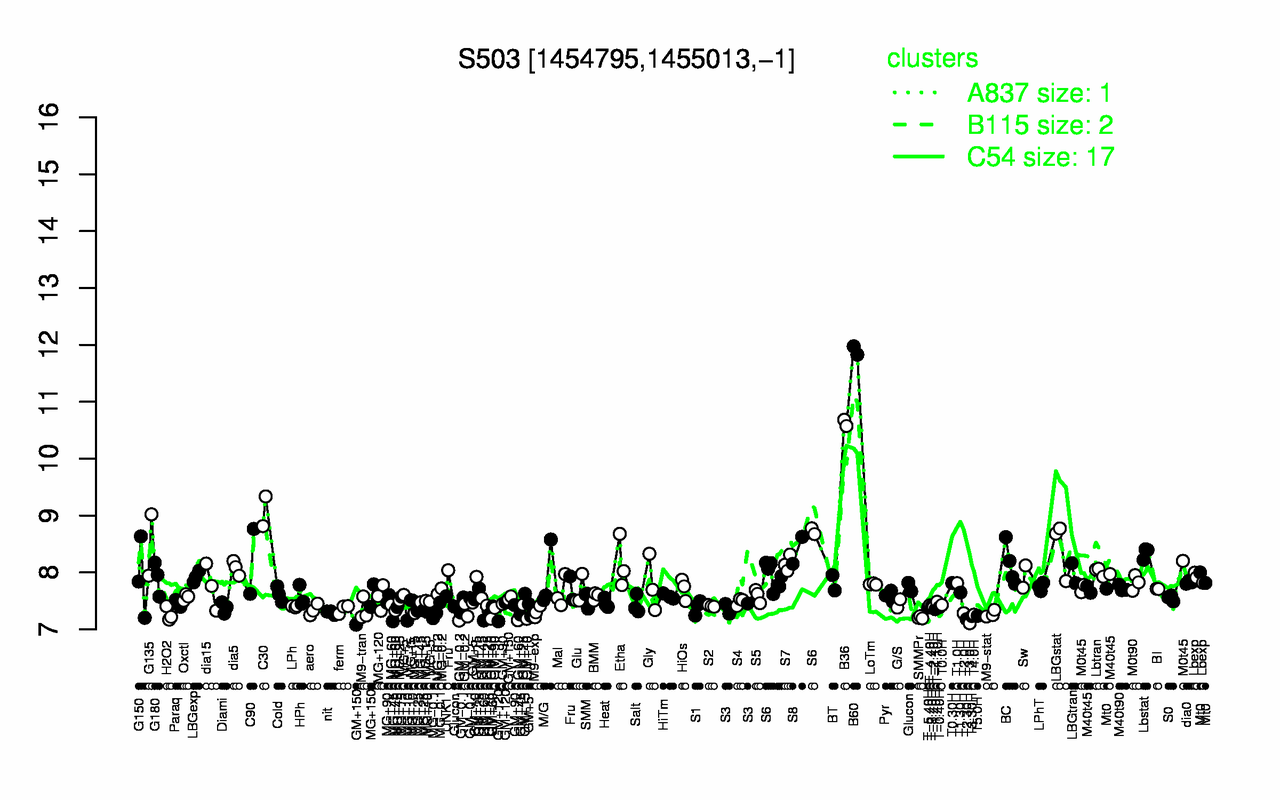
| B60 | B36 | C30 | G135 | LBGstat | S8 | Lbstat | C90 | Etha | S7 |
| 11.9 | 10.6 | 9.08 | 8.48 | 8.43 | 8.39 | 8.34 | 8.2 | 8.16 | 8.16 |
| T3.0H | T2.30H | SMMPr | T3.30H | T5.0H | GM+60 | T4.0H | H2O2 | M9-stat | GM-0.2 |
| 7.11 | 7.18 | 7.21 | 7.23 | 7.24 | 7.24 | 7.26 | 7.27 | 7.27 | 7.28 |