| Start Page |
|
 |
| Start Page |
|
|
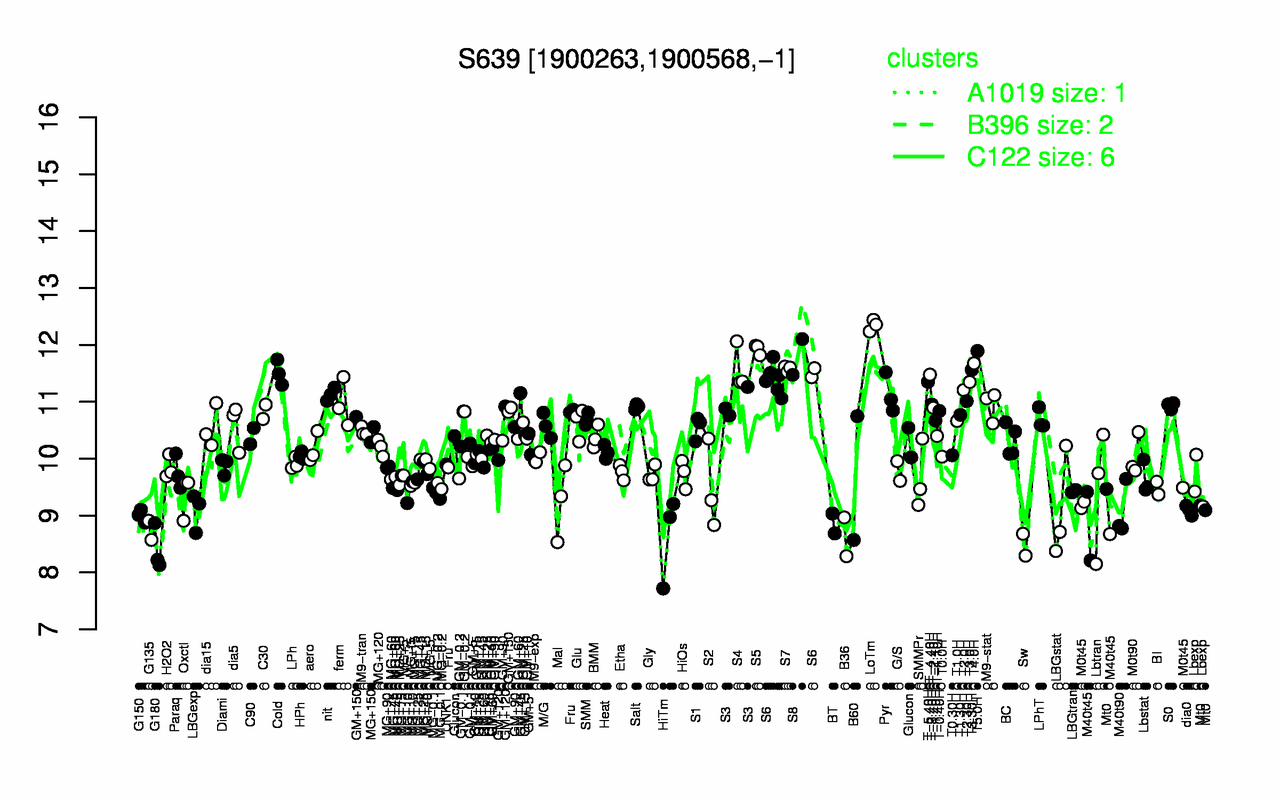
| LoTm | S5 | T5.0H | S8 | T4.0H | S4 | S7 | T3.30H | Cold | T-4.40H |
| 12.3 | 11.9 | 11.9 | 11.8 | 11.7 | 11.6 | 11.6 | 11.6 | 11.5 | 11.5 |
| G180 | Sw | B36 | HiTm | G135 | M40t45 | BT | G150 | M40t90 | LBGexp |
| 8.41 | 8.49 | 8.63 | 8.63 | 8.74 | 8.77 | 8.86 | 9 | 9.08 | 9.08 |