| Start Page |
|
 |
| Start Page |
|
|
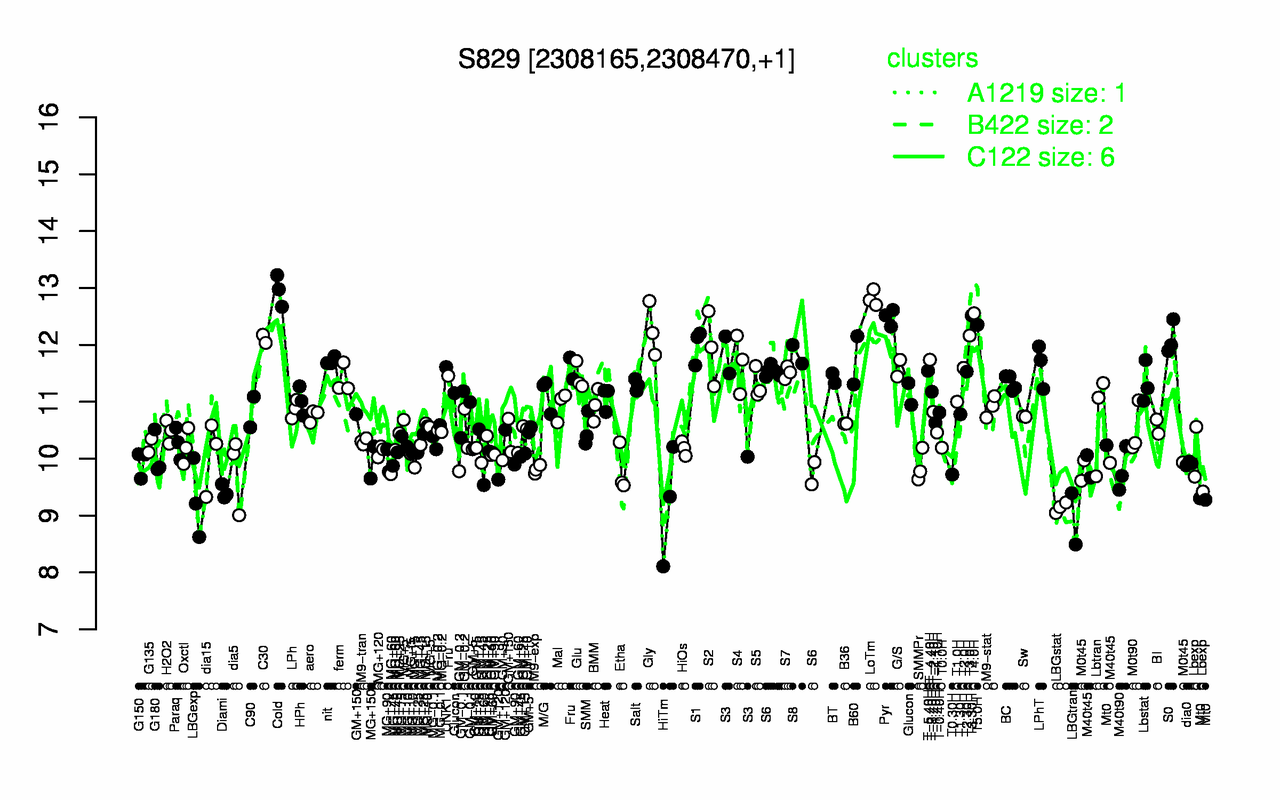
| Cold | LoTm | T4.0H | T3.30H | Pyr | T5.0H | Gly | T3.0H | S0 | C30 |
| 13 | 12.8 | 12.6 | 12.5 | 12.5 | 12.4 | 12.3 | 12.2 | 12.1 | 12.1 |
| LBGtran | LBGstat | HiTm | LBGexp | Diami | Mt0 | T0.30H | dia5 | M40t90 | Etha |
| 8.94 | 9.14 | 9.22 | 9.28 | 9.41 | 9.61 | 9.72 | 9.78 | 9.79 | 9.8 |