| Start Page |
|
 |
| Start Page |
|
|
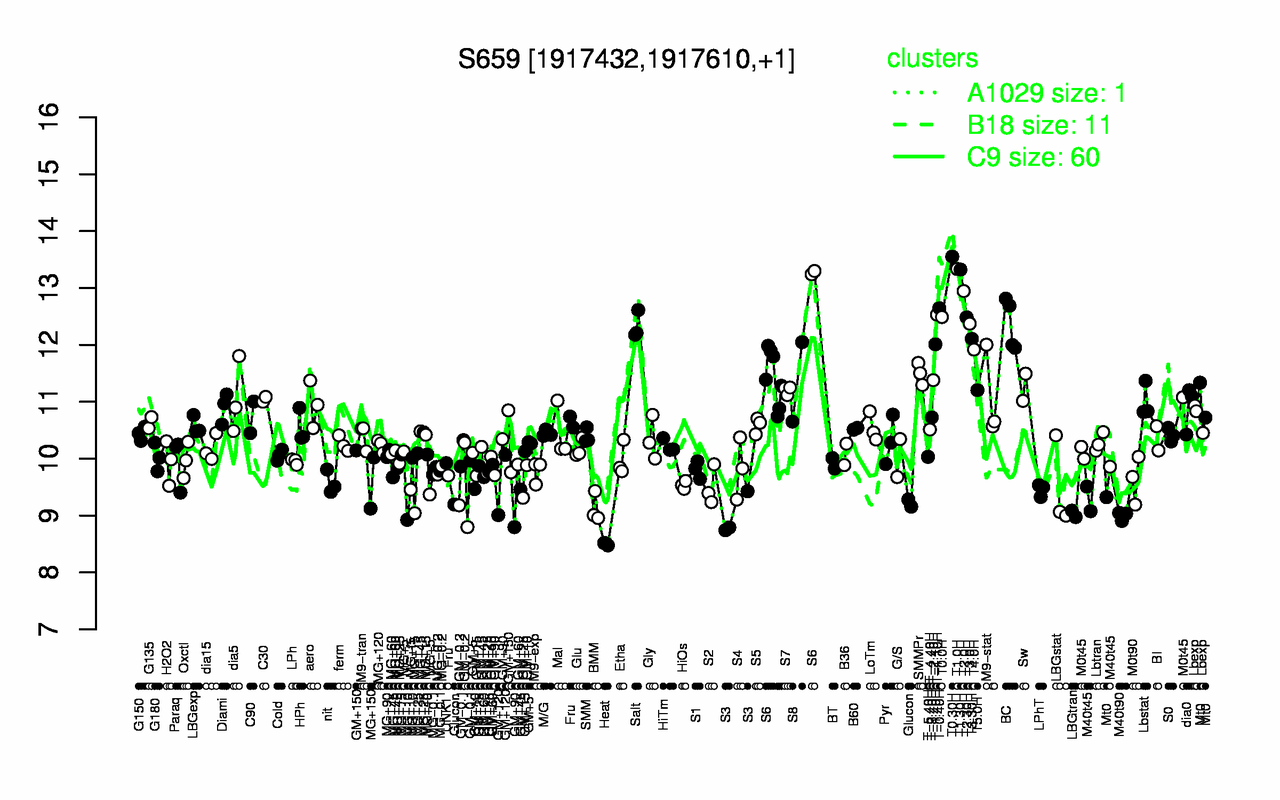
| T0.30H | T1.0H | T1.30H | T2.0H | T-0.40H | T-1.10H | T0.0H | T2.30H | T3.0H | BC |
| 13.6 | 13.3 | 13.3 | 12.9 | 12.6 | 12.5 | 12.5 | 12.5 | 12.4 | 12.4 |
| Heat | S3 | M40t90 | LBGtran | BMM | Glucon | GM-0.2 | LPhT | MG+t5 | M40t45 |
| 8.5 | 8.99 | 9 | 9.03 | 9.13 | 9.21 | 9.42 | 9.45 | 9.46 | 9.48 |