| Start Page |
|
 |
| Start Page |
|
|
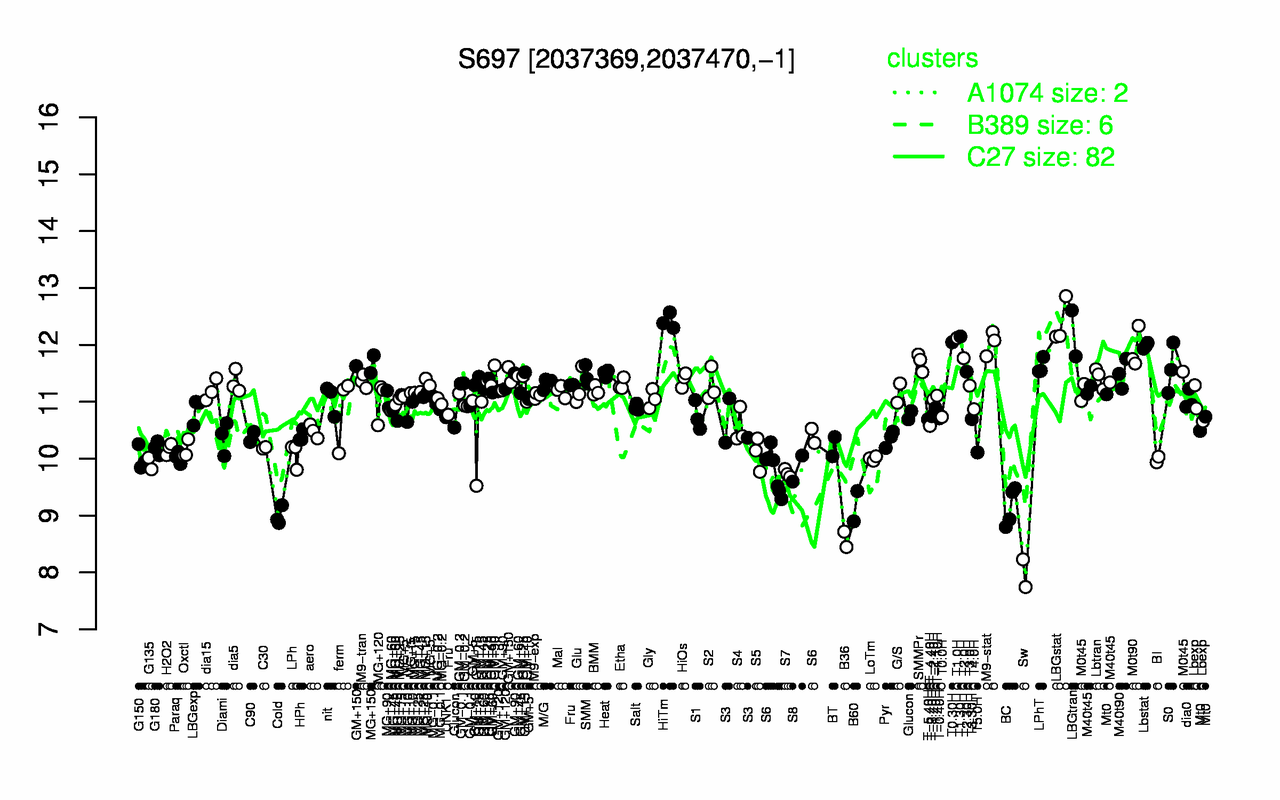
| HiTm | LBGstat | LBGtran | T1.30H | T1.0H | T0.30H | M9-stat | Lbstat | M0t90 | T2.0H |
| 12.4 | 12.4 | 12.2 | 12.1 | 12.1 | 12 | 12 | 12 | 11.9 | 11.8 |
| Sw | B36 | Cold | BC | B60 | S7 | S8 | G135 | S6 | BI |
| 7.99 | 8.58 | 8.99 | 9.16 | 9.17 | 9.74 | 9.83 | 9.91 | 9.92 | 9.99 |