| Start Page |
|
 |
| Start Page |
|
|
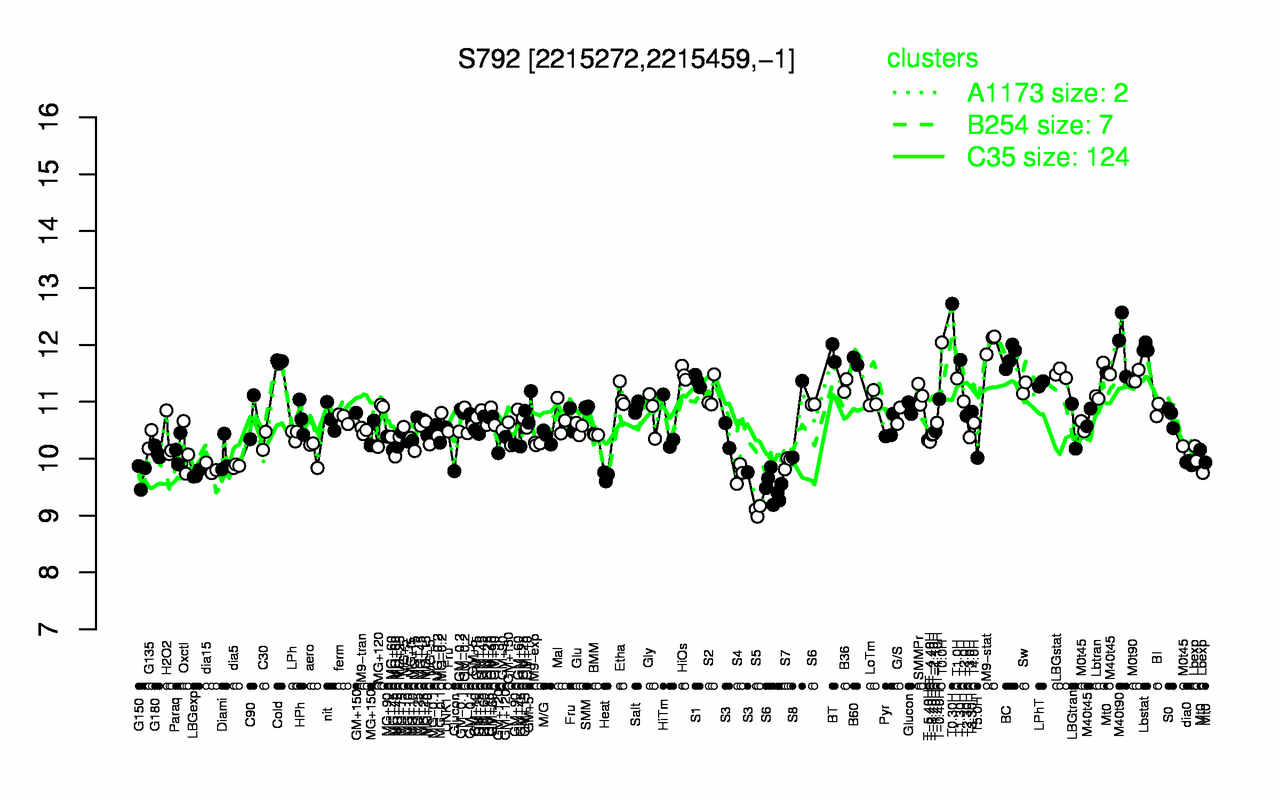
| T0.30H | T0.0H | M9-stat | M40t90 | Lbstat | BT | BC | T1.30H | B60 | Cold |
| 12.7 | 12 | 12 | 12 | 12 | 11.9 | 11.8 | 11.7 | 11.7 | 11.7 |
| S5 | Heat | G150 | LBGexp | S4 | S6 | dia15 | dia5 | dia0 | S7 |
| 9.09 | 9.7 | 9.72 | 9.73 | 9.74 | 9.81 | 9.83 | 9.87 | 9.93 | 9.94 |