| Start Page |
|
 |
| Start Page |
|
|
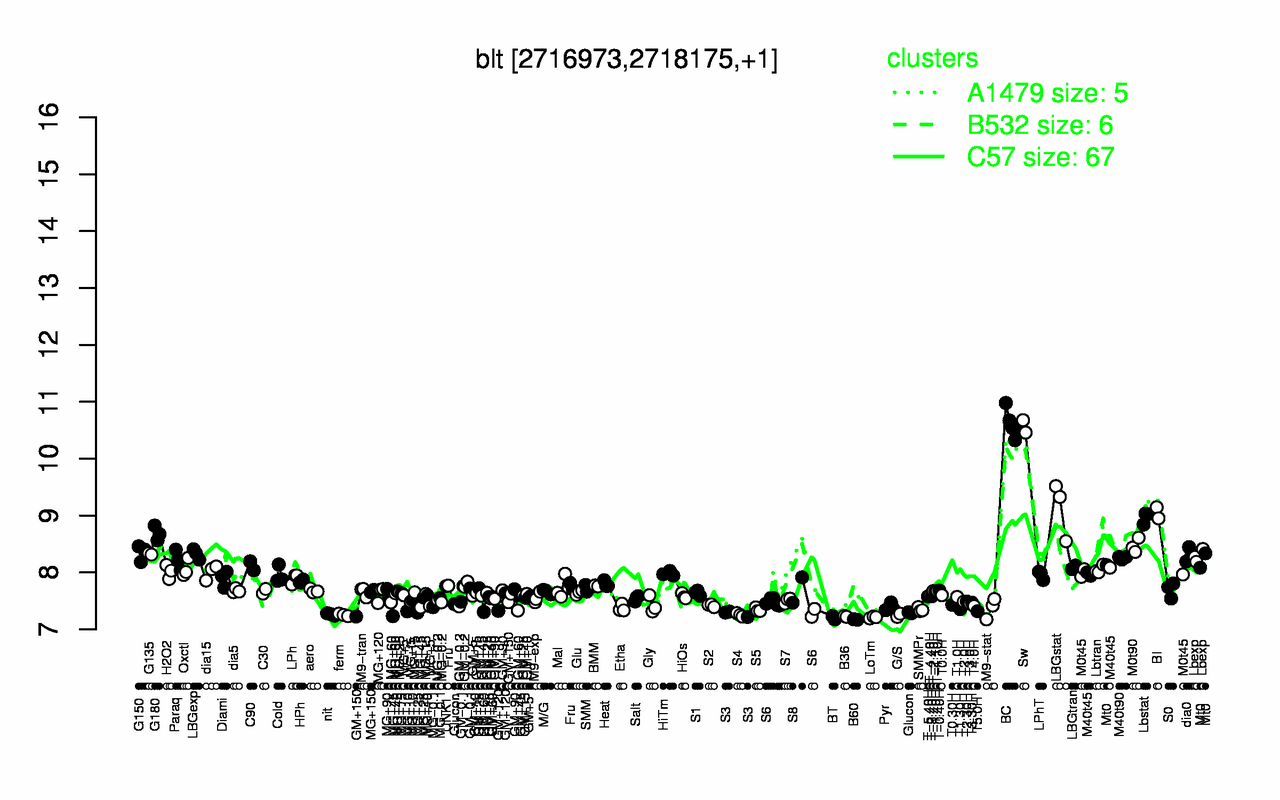
| BC | Sw | LBGstat | BI | Lbstat | G180 | M0t90 | G150 | G135 | LBGexp |
| 10.6 | 10.6 | 9.13 | 9.05 | 8.97 | 8.69 | 8.47 | 8.35 | 8.33 | 8.32 |
| B60 | BT | LoTm | B36 | G/S | ferm | S4 | nit | S3 | T5.0H |
| 7.17 | 7.2 | 7.21 | 7.23 | 7.25 | 7.25 | 7.25 | 7.26 | 7.28 | 7.32 |