B. subtilis Expression Data Browser
Start Page
B. subtilis Expression Data Browser
Gene/Segment:
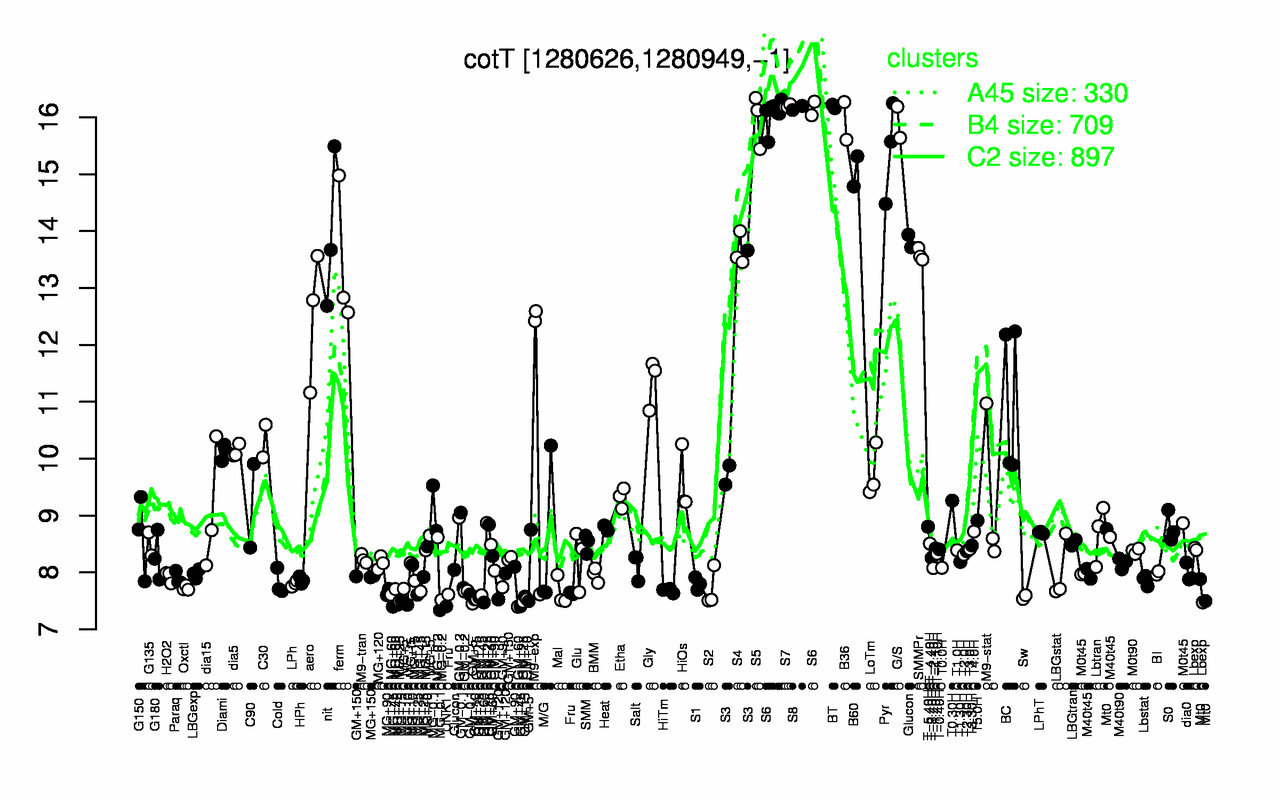
cotT
Locus Tag:
BSU12090
Details about cotT
Show/Hide
Highest Expression Conditions
S7
BT
S8
S6
S5
B36
G/S
Pyr
B60
nit
16.2
16.2
16.2
16.1
16
15.9
15.9
15.4
15.1
13.9
Lowest Expression Conditions
UNK1
MG+45
GM+10
Sw
Fru
MG+90
Mal
MG+60
MG+25
HiTm
7.41
7.5
7.53
7.57
7.63
7.66
7.66
7.66
7.67
7.68
Most Positively Correlated Segments
cotZ
cotF
S420
cotY
yxeE
S530
ykzV
cotB
gerPF
sspJ
0.96
0.96
0.96
0.96
0.94
0.94
0.94
0.93
0.92
0.92
Most Negatively Correlated Segments
sfp
yddS
yeaC
azlC
sfp
yjkB
ybdM
yfiF
yybA
nosA
-0.8
-0.8
-0.8
-0.79
-0.78
-0.78
-0.78
-0.78
-0.77
-0.77
Expression Profile of Segment cotT
Show/Hide
Annotation of Gene cotT
Show/Hide
function
16.5: Explore
function
16.13: Shape
inference
ab initio prediction:AMIGene:2.0
codon_start
1
product
spore coat protein (inner coat)
transl_table
11
note
Evidence 1a: Function experimentally demonstrated in the studied strain; PubMedId: 1391045, 1917883; Product type cp: cell process
db_xref
GI:2633563
protein_id
CAB13066.1
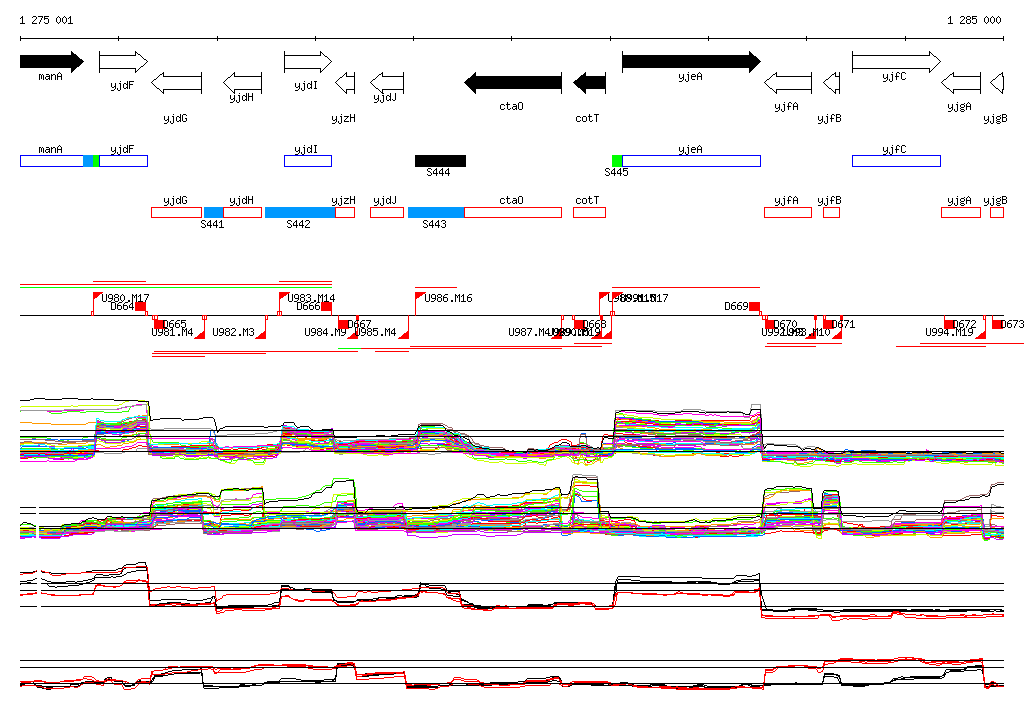
Genomic View of Gene/Segment cotT
Show/Hide
(Legend)
Browse Genome Context