| Start Page |
|
 |
| Start Page |
|
|
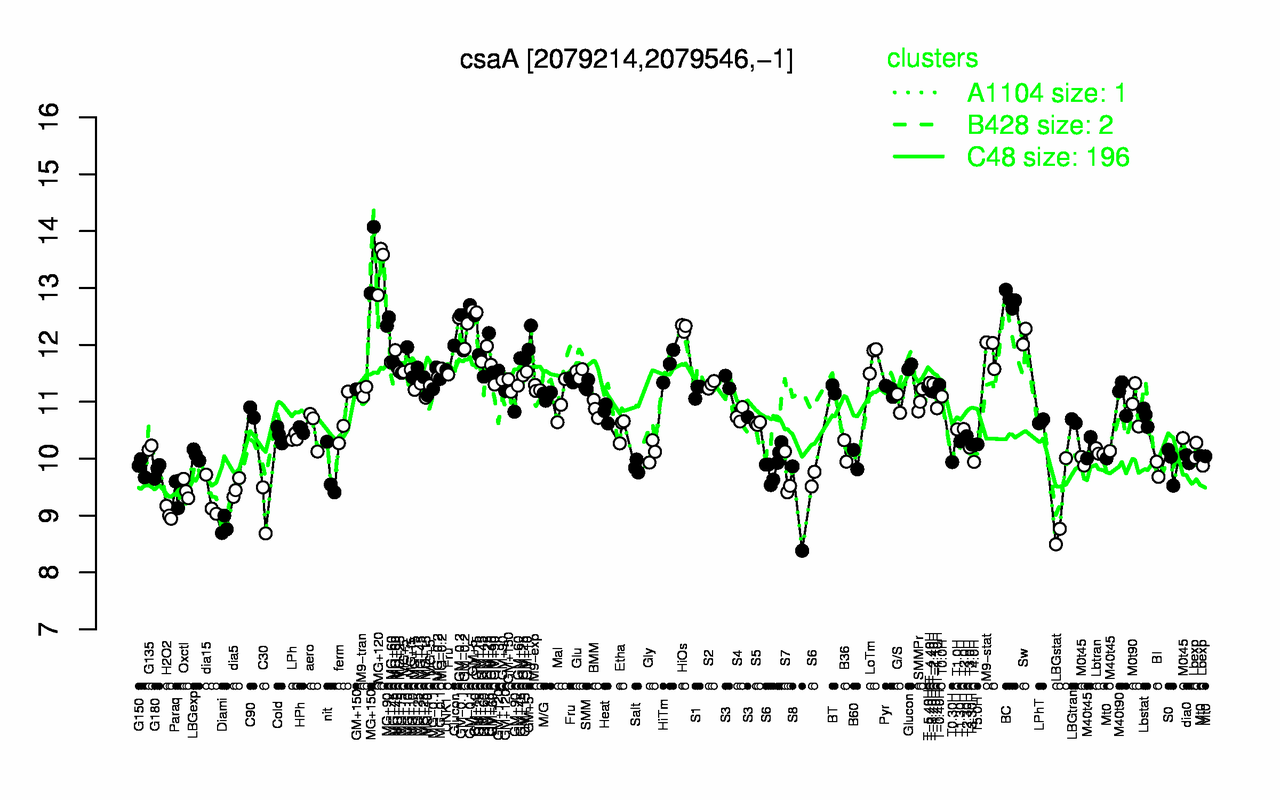
| MG+150 | MG+120 | BC | MG+90 | GM-0.1 | HiOs | GM+5 | GM-0.2 | GM+15 | Sw |
| 13.5 | 13.4 | 12.8 | 12.4 | 12.4 | 12.3 | 12.3 | 12.3 | 12.2 | 12.1 |
| Diami | H2O2 | LBGstat | C30 | S8 | dia15 | Paraq | Oxctl | dia5 | S7 |
| 8.82 | 9.04 | 9.09 | 9.09 | 9.12 | 9.29 | 9.45 | 9.46 | 9.48 | 9.69 |