| Start Page |
|
 |
| Start Page |
|
|
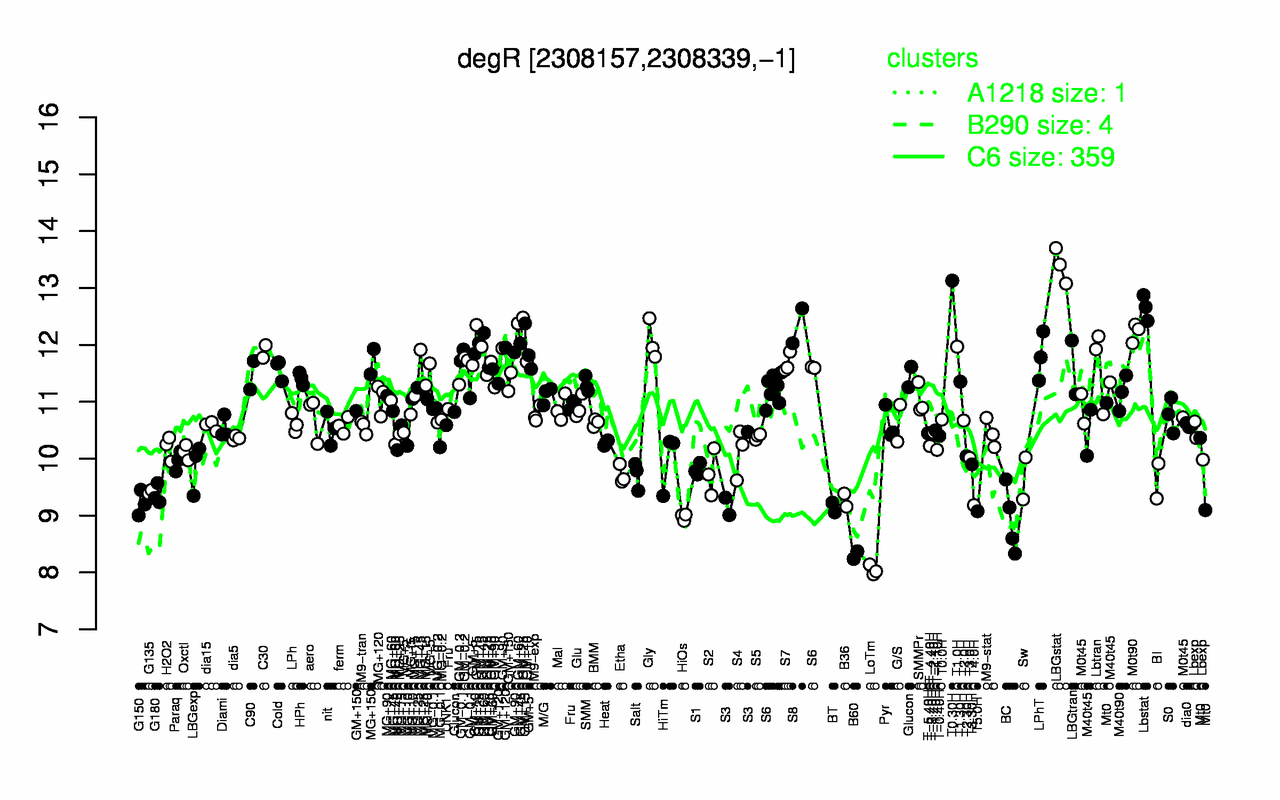
| LBGstat | T0.30H | Lbstat | S8 | M0t90 | GM+15 | Gly | GM+60 | GM+25 | T1.0H |
| 13.4 | 13.1 | 12.7 | 12.3 | 12.2 | 12.1 | 12.1 | 12.1 | 12 | 12 |
| LoTm | B60 | BC | HiOs | T5.0H | BT | T4.0H | G150 | B36 | G180 |
| 8.04 | 8.3 | 8.93 | 8.98 | 9.08 | 9.14 | 9.18 | 9.22 | 9.27 | 9.37 |