| Start Page |
|
 |
| Start Page |
|
|
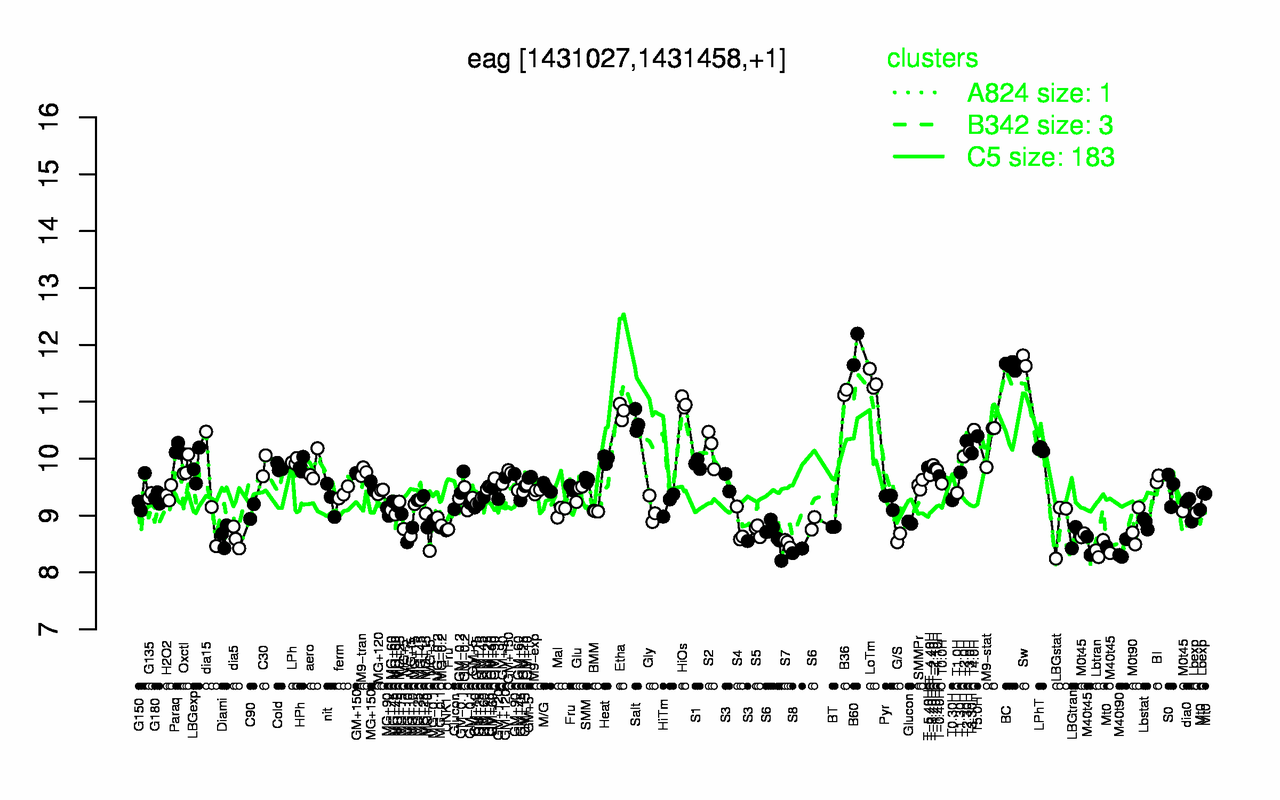
| B60 | Sw | BC | LoTm | B36 | HiOs | Etha | Salt | T4.0H | T5.0H |
| 11.9 | 11.7 | 11.6 | 11.4 | 11.2 | 11 | 10.8 | 10.7 | 10.5 | 10.4 |
| S8 | M40t90 | Lbtran | M40t45 | S7 | MG+5 | dia5 | G/S | LBGtran | MG+t5 |
| 8.38 | 8.39 | 8.41 | 8.43 | 8.51 | 8.57 | 8.61 | 8.61 | 8.61 | 8.64 |