| Start Page |
|
 |
| Start Page |
|
|
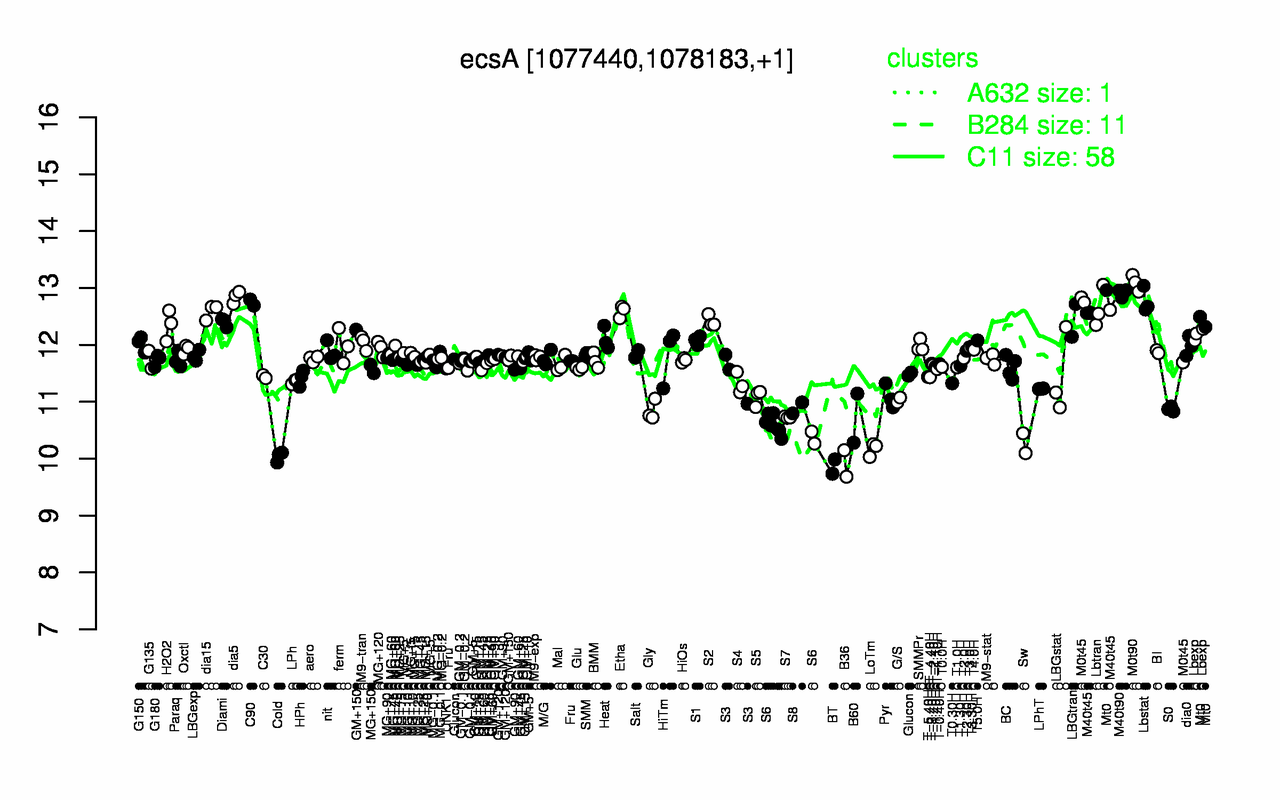
| M0t90 | M40t90 | dia5 | Lbstat | C90 | Lbtran | Etha | Mt0 | dia15 | M40t45 |
| 13.1 | 12.9 | 12.8 | 12.8 | 12.7 | 12.7 | 12.6 | 12.6 | 12.6 | 12.6 |
| BT | B36 | Cold | LoTm | Sw | S6 | B60 | S7 | Gly | S0 |
| 9.86 | 9.92 | 10 | 10.2 | 10.3 | 10.5 | 10.7 | 10.7 | 10.8 | 10.9 |