| Start Page |
|
 |
| Start Page |
|
|
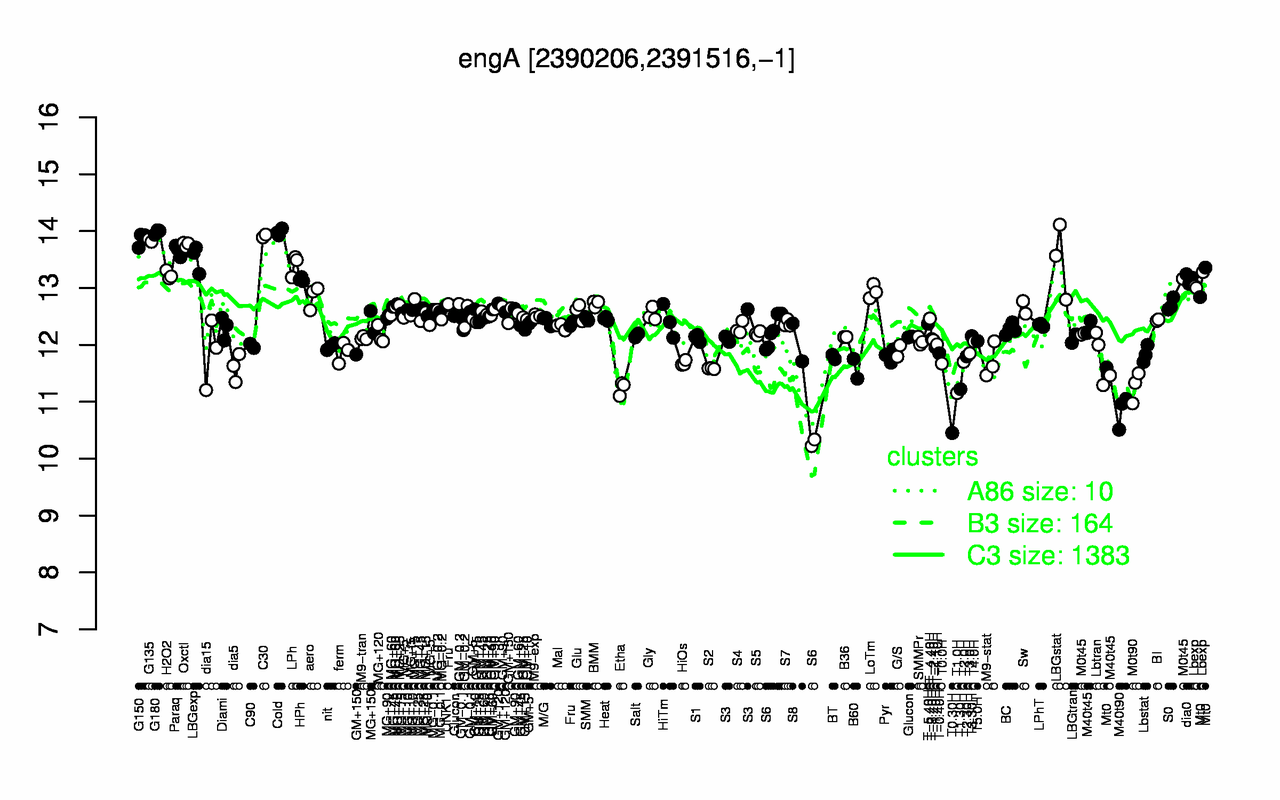
| G180 | Cold | C30 | G150 | G135 | Oxctl | Paraq | LBGexp | LBGstat | LPh |
| 14 | 14 | 13.9 | 13.9 | 13.8 | 13.8 | 13.7 | 13.5 | 13.5 | 13.4 |
| T0.30H | M40t90 | T1.0H | T1.30H | Etha | M0t90 | B60 | S2 | dia5 | T0.0H |
| 10.5 | 10.8 | 11.2 | 11.2 | 11.2 | 11.3 | 11.6 | 11.6 | 11.6 | 11.7 |