B. subtilis Expression Data Browser
Start Page
B. subtilis Expression Data Browser
Gene/Segment:
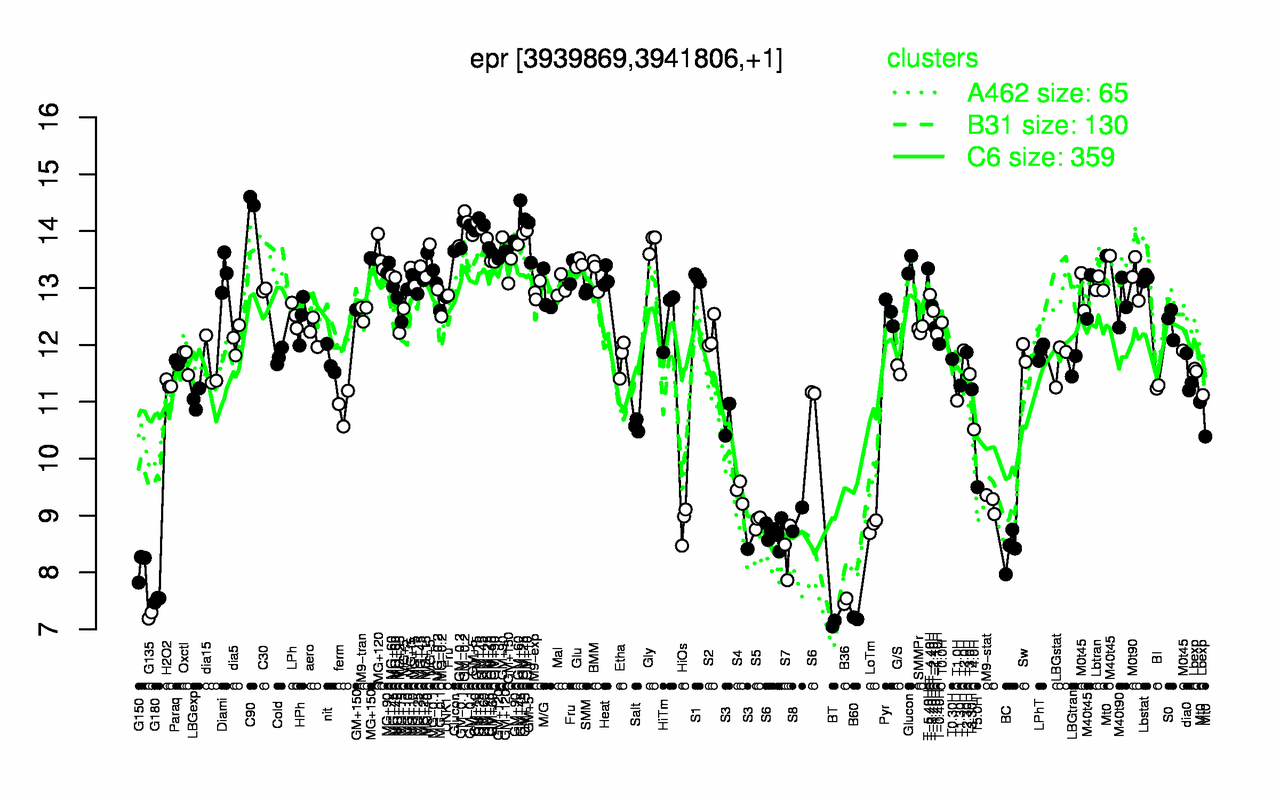
epr
Locus Tag:
BSU38400
Details about epr
Show/Hide
Highest Expression Conditions
C90
GM-0.2
GM+15
GM+45
GM+25
GM+10
GM-0.1
GM+5
GM+60
Gly
14.5
14.1
14
14
14
14
14
13.8
13.8
13.8
Lowest Expression Conditions
BT
B60
G135
B36
G180
G150
S7
BC
LoTm
HiOs
7.1
7.19
7.24
7.49
7.52
8.12
8.39
8.4
8.82
8.85
Most Positively Correlated Segments
lytF
lytD
fliT
mcpB
pgdS
cheV
fliS
yvzG
yfmS
yfmT
0.95
0.94
0.93
0.93
0.92
0.92
0.91
0.91
0.91
0.91
Most Negatively Correlated Segments
spoIIE
yhaL
yabS
S162
ydcC
yhbB
ymxH
spmA
spoIID
spoVID
-0.74
-0.73
-0.73
-0.73
-0.73
-0.72
-0.72
-0.72
-0.72
-0.72
Expression Profile of Segment epr
Show/Hide
Annotation of Gene epr
Show/Hide
function
16.5: Explore
function
16.11: Scavenge (Catabolism)
inference
ab initio prediction:AMIGene:2.0
codon_start
1
EC_number
3.4.21.-
transl_table
11
note
Evidence 1a: Function experimentally demonstrated in the studied strain; PubMedId: 16553828, 17666034, 1938892, 2116590; Product type e: enzyme
db_xref
GI:2636375
product
extracellular serine protease
protein_id
CAB15866.1
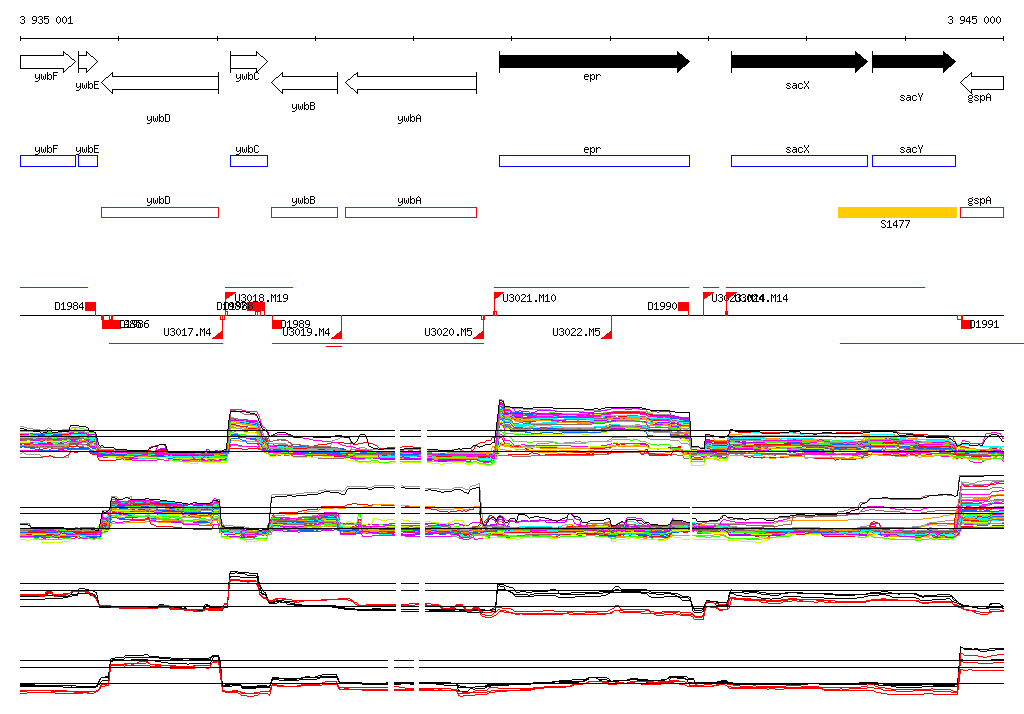
Genomic View of Gene/Segment epr
Show/Hide
(Legend)
Browse Genome Context