| Start Page |
|
 |
| Start Page |
|
|
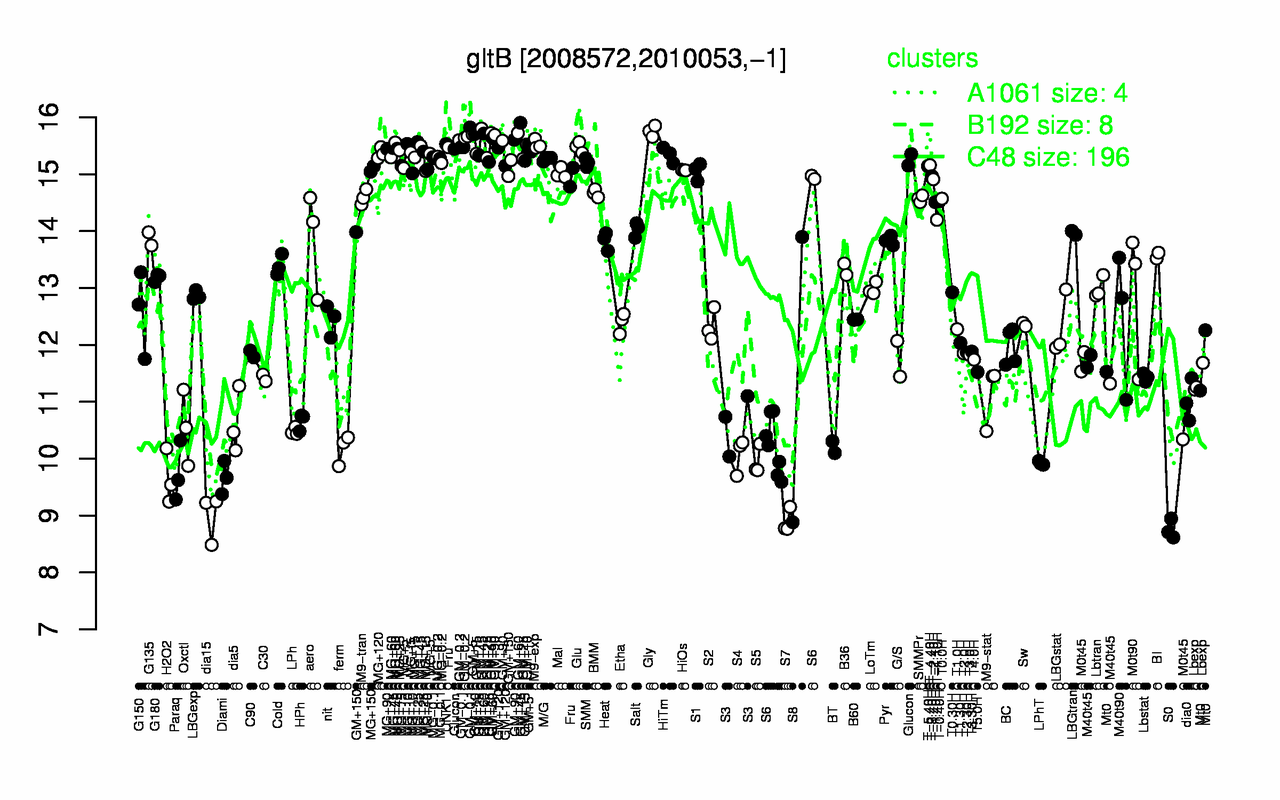
| GM+45 | Gly | GM+60 | GM-0.2 | GM+90 | GM+10 | GM-0.1 | GM+5 | UNK1 | M9-exp |
| 15.8 | 15.8 | 15.7 | 15.6 | 15.6 | 15.6 | 15.6 | 15.5 | 15.5 | 15.5 |
| S0 | S7 | dia15 | H2O2 | Diami | Paraq | LPhT | S5 | S4 | ferm |
| 8.76 | 8.9 | 8.99 | 9.66 | 9.67 | 9.74 | 9.92 | 9.96 | 10.1 | 10.2 |