| Start Page |
|
 |
| Start Page |
|
|
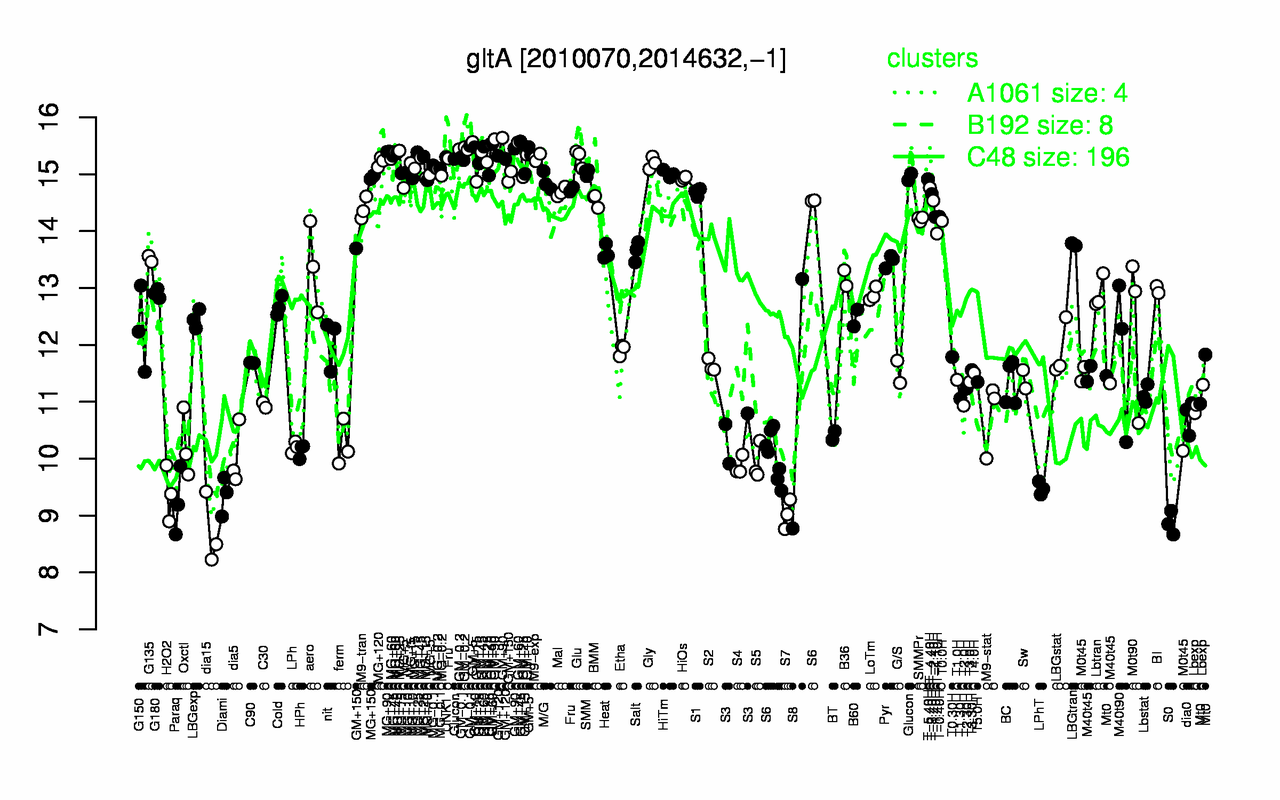
| GM+90 | GM+60 | GM+45 | GM+5 | GM-0.2 | GM+10 | MG+90 | MG+25 | GM-0.1 | MG+45 |
| 15.6 | 15.5 | 15.5 | 15.5 | 15.4 | 15.4 | 15.4 | 15.4 | 15.3 | 15.3 |
| dia15 | S0 | S7 | Paraq | Diami | H2O2 | LPhT | S4 | S5 | dia5 |
| 8.71 | 8.87 | 9.02 | 9.24 | 9.35 | 9.39 | 9.48 | 9.87 | 9.93 | 10 |