| Start Page |
|
 |
| Start Page |
|
|
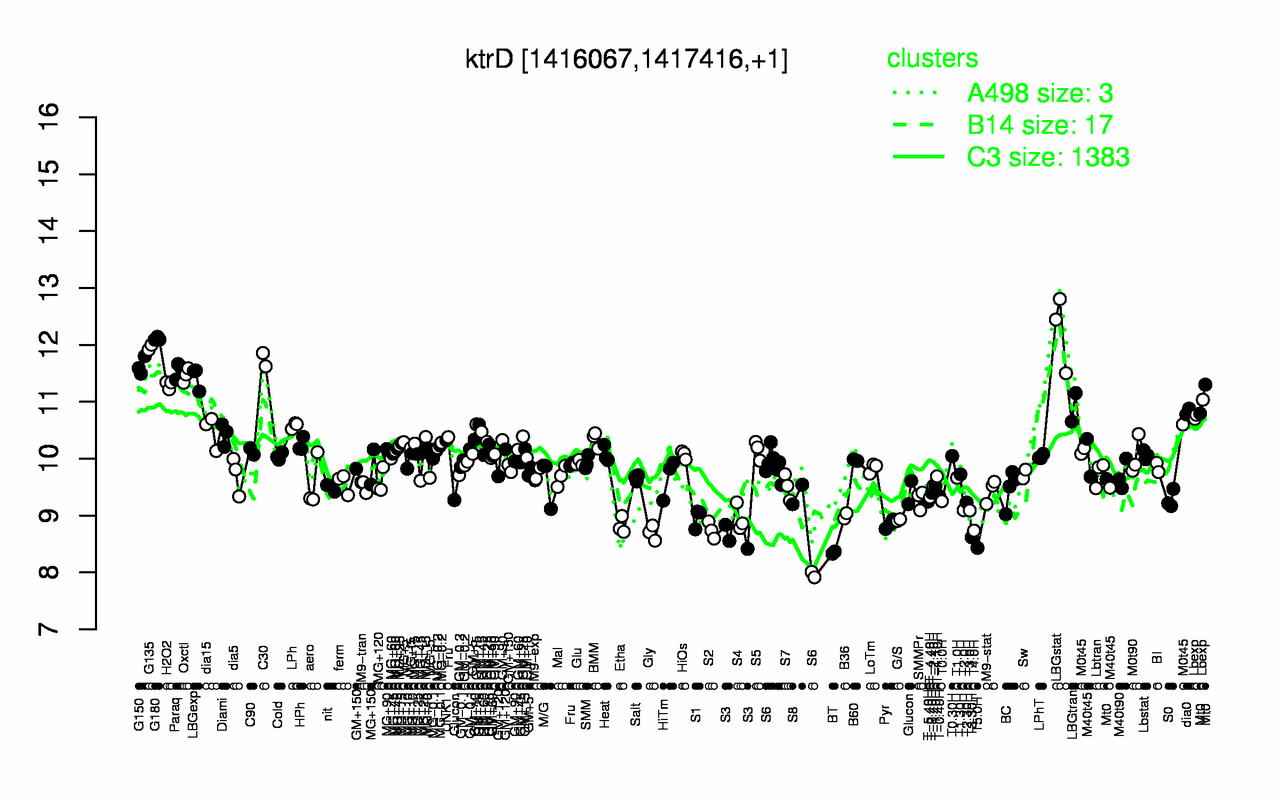
| LBGstat | G180 | G135 | C30 | G150 | Paraq | Oxctl | LBGexp | H2O2 | LBGtran |
| 12.3 | 12.1 | 12 | 11.7 | 11.6 | 11.6 | 11.5 | 11.4 | 11.3 | 10.9 |
| BT | T5.0H | S3 | T3.30H | Gly | T4.0H | S2 | Etha | Pyr | G/S |
| 8.35 | 8.43 | 8.6 | 8.62 | 8.7 | 8.73 | 8.74 | 8.82 | 8.85 | 8.92 |