| Start Page |
|
 |
| Start Page |
|
|
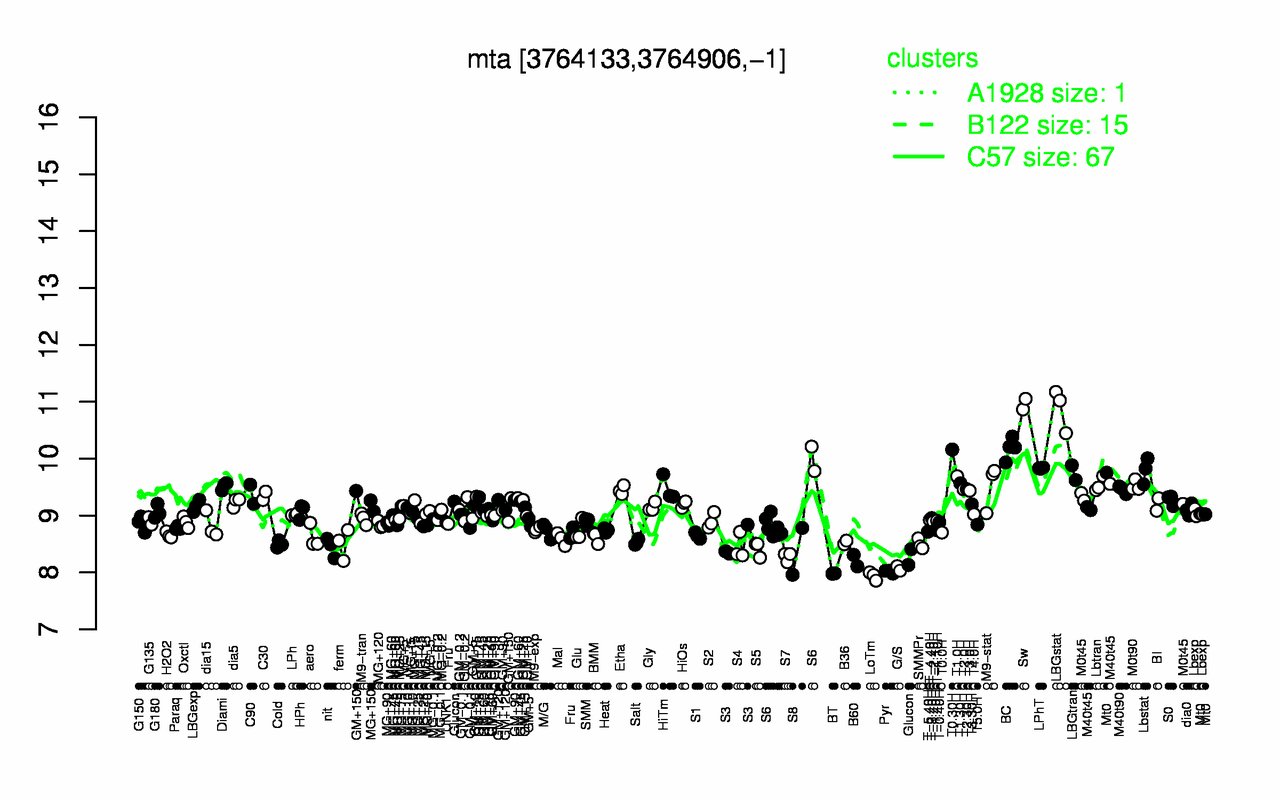
| Sw | LBGstat | BC | T0.30H | LPhT | Lbstat | LBGtran | T1.0H | T1.30H | Lbtran |
| 11 | 10.9 | 10.2 | 10.2 | 9.83 | 9.79 | 9.75 | 9.69 | 9.57 | 9.54 |
| LoTm | BT | Pyr | G/S | B60 | S7 | S8 | S5 | nit | S4 |
| 7.94 | 7.98 | 8.02 | 8.07 | 8.21 | 8.27 | 8.37 | 8.42 | 8.44 | 8.44 |