| Start Page |
|
 |
| Start Page |
|
|
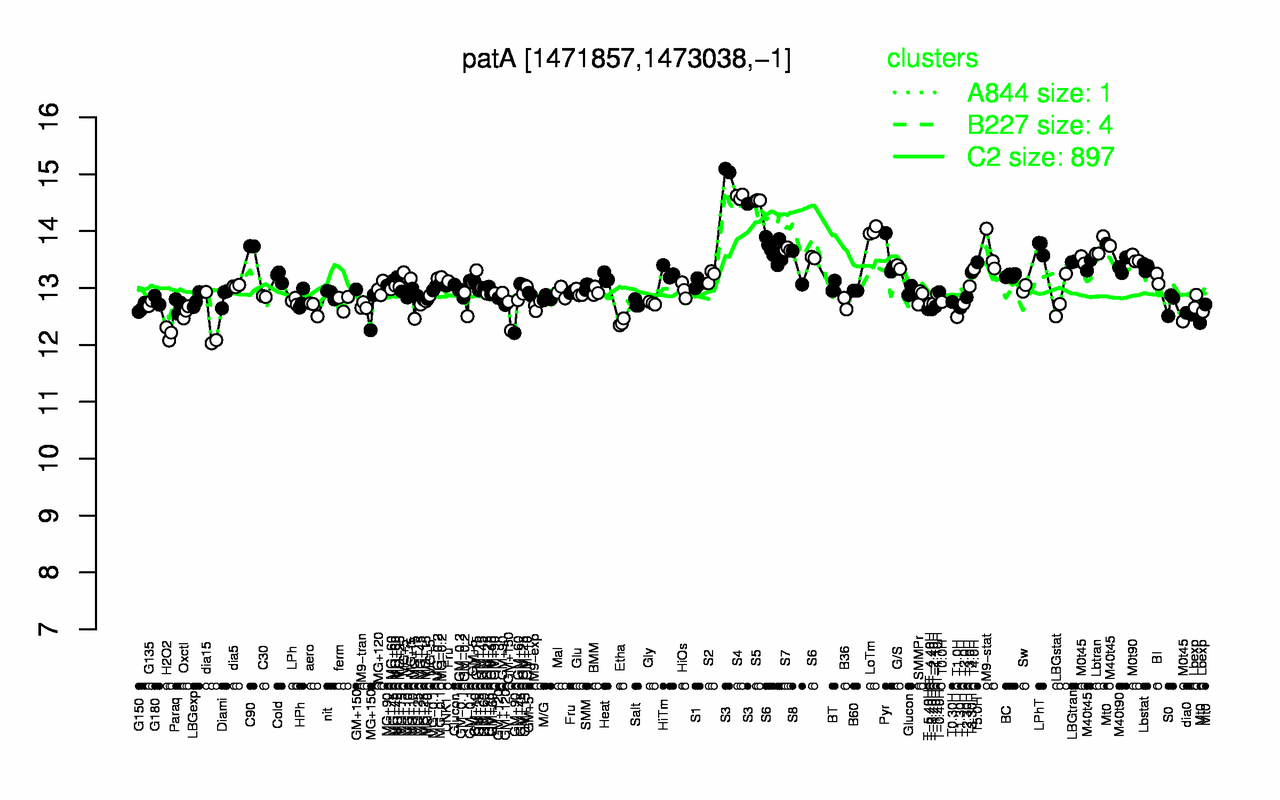
| S3 | S4 | S5 | LoTm | C90 | LPhT | Lbtran | S7 | S6 | M9-stat |
| 14.9 | 14.6 | 14.5 | 14 | 13.7 | 13.7 | 13.7 | 13.7 | 13.6 | 13.6 |
| H2O2 | dia15 | Etha | T1.0H | dia0 | MG+150 | Oxctl | T-3.40H | T-5.40H | G150 |
| 12.2 | 12.3 | 12.4 | 12.5 | 12.6 | 12.6 | 12.6 | 12.6 | 12.6 | 12.6 |