| Start Page |
|
 |
| Start Page |
|
|
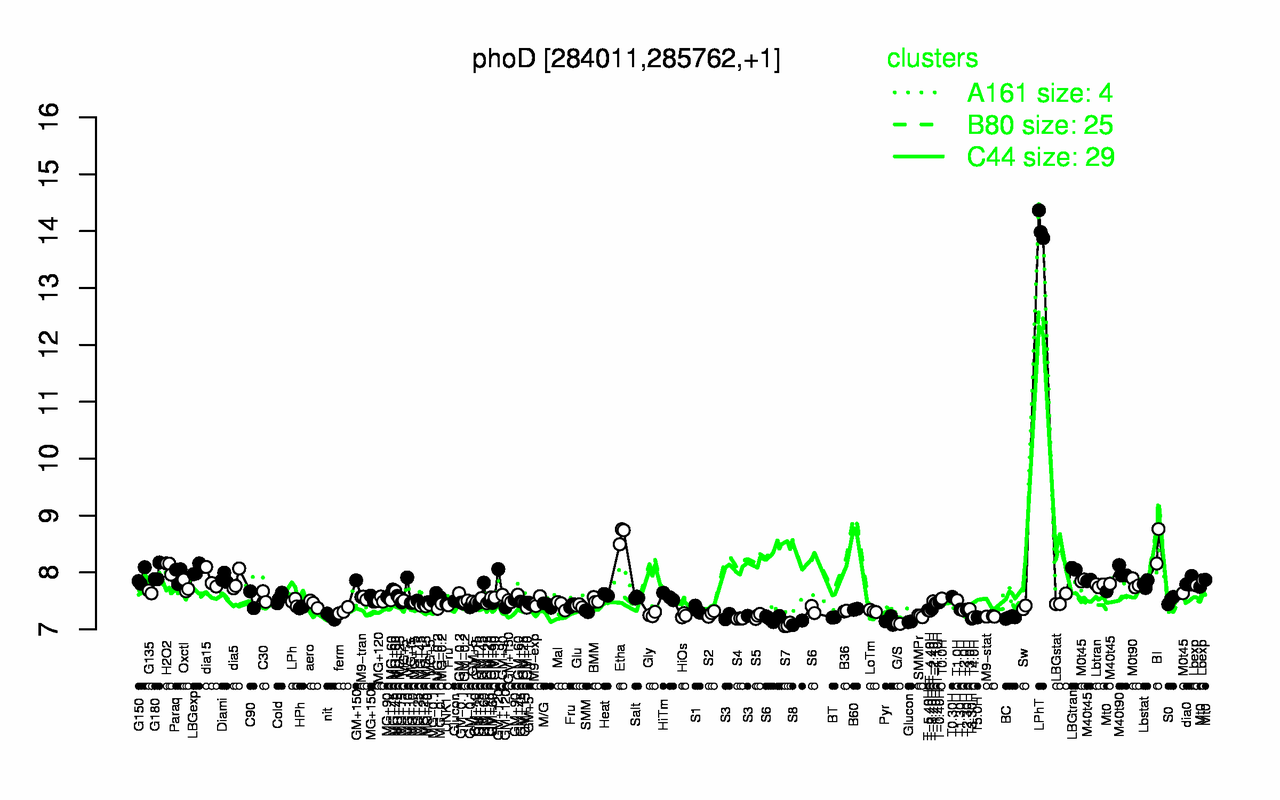
| LPhT | Etha | BI | H2O2 | LBGtran | LBGexp | M40t90 | G180 | Paraq | G150 |
| 14.1 | 8.67 | 8.46 | 8.09 | 8.06 | 8.04 | 8.01 | 7.98 | 7.97 | 7.91 |
| S7 | G/S | S8 | Pyr | T3.30H | S4 | BT | BC | T5.0H | T4.0H |
| 7.08 | 7.1 | 7.11 | 7.15 | 7.19 | 7.19 | 7.21 | 7.21 | 7.21 | 7.21 |