| Start Page |
|
 |
| Start Page |
|
|
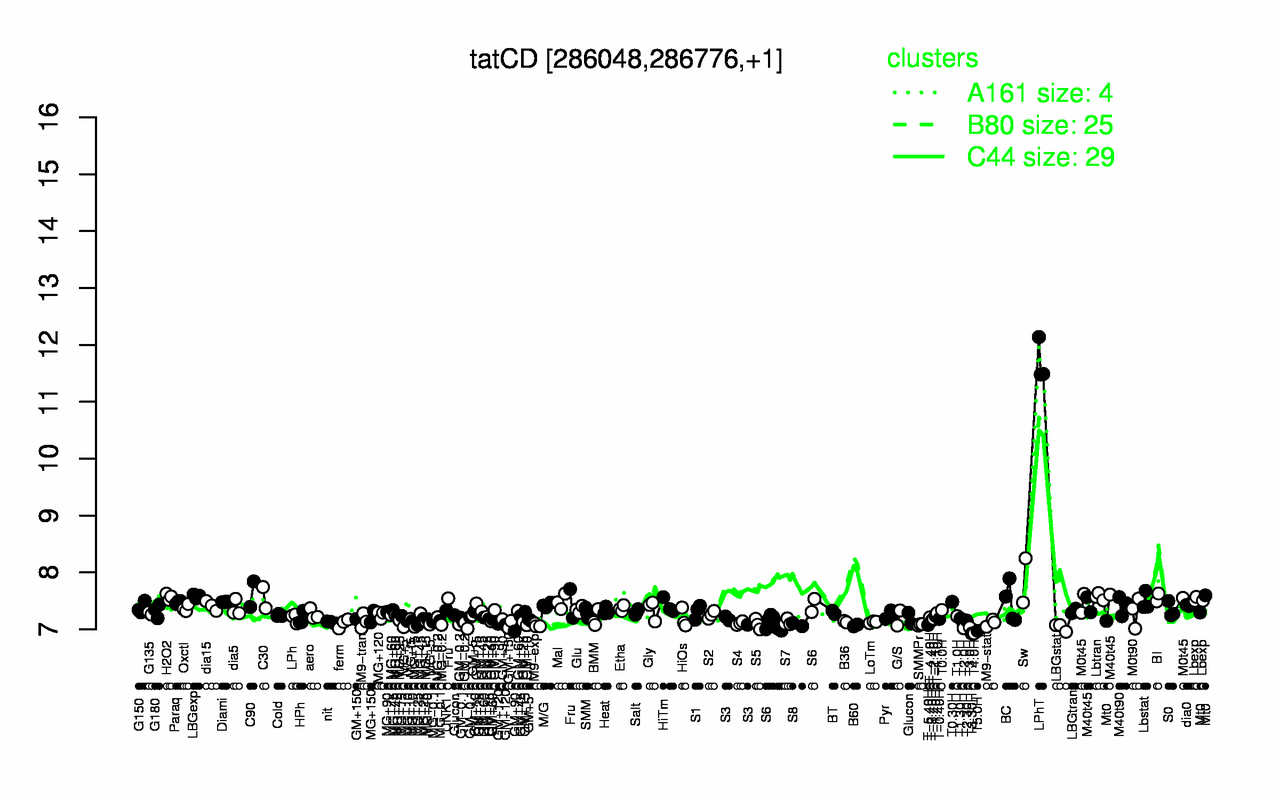
| LPhT | Sw | C90 | LBGexp | Lbtran | H2O2 | BI | C30 | Lbexp | M40t45 |
| 11.7 | 7.86 | 7.62 | 7.58 | 7.57 | 7.57 | 7.56 | 7.56 | 7.53 | 7.49 |
| T4.0H | T3.30H | T5.0H | T2.0H | T3.0H | LBGstat | MG+5 | B60 | M9-exp | GM-0.2 |
| 6.93 | 6.93 | 6.97 | 7.02 | 7.03 | 7.04 | 7.06 | 7.07 | 7.07 | 7.07 |