| Start Page |
|
 |
| Start Page |
|
|
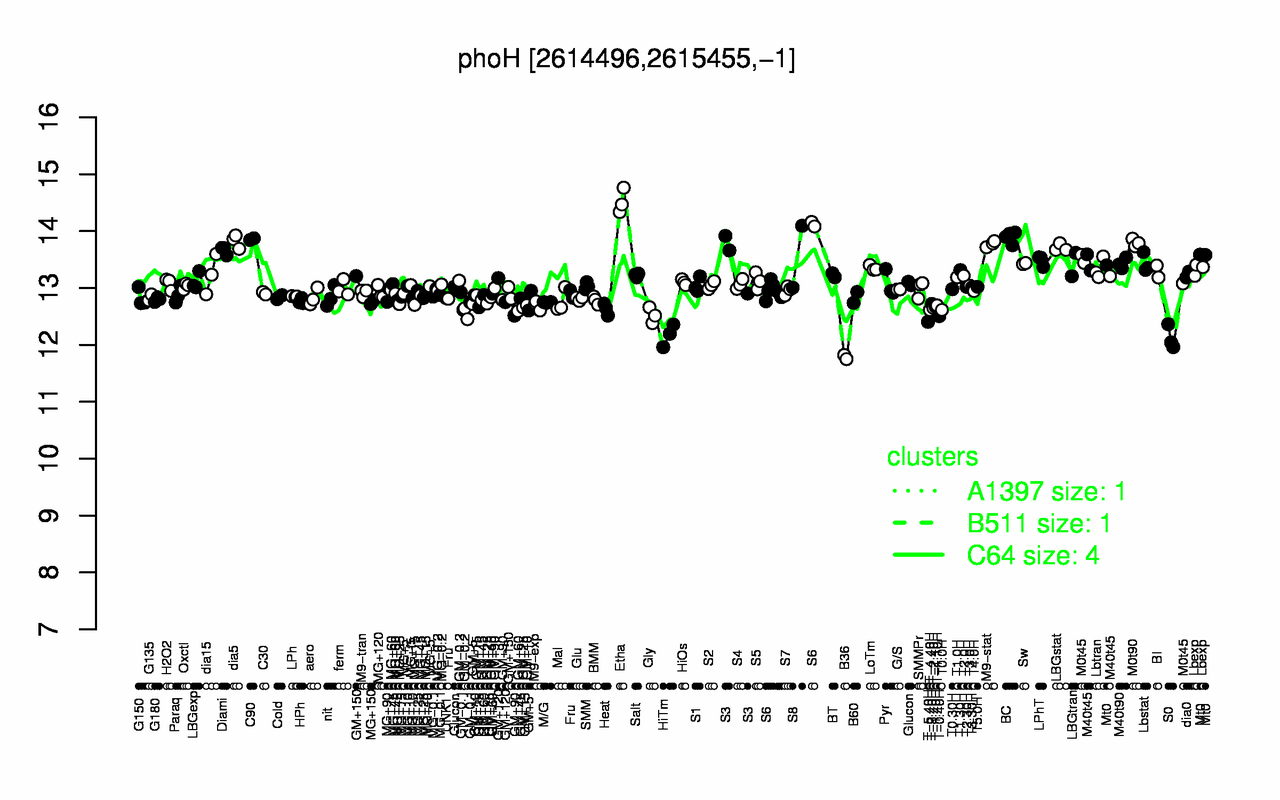
| Etha | BC | C90 | dia5 | M0t90 | M9-stat | LBGstat | Diami | S8 | Mt0 |
| 14.5 | 13.9 | 13.9 | 13.8 | 13.8 | 13.8 | 13.7 | 13.7 | 13.5 | 13.5 |
| B36 | S0 | HiTm | T-5.40H | T-0.40H | Gly | T-4.40H | T0.0H | Heat | T-2.40H |
| 11.8 | 12.1 | 12.2 | 12.4 | 12.5 | 12.5 | 12.6 | 12.6 | 12.6 | 12.6 |