| Start Page |
|
 |
| Start Page |
|
|
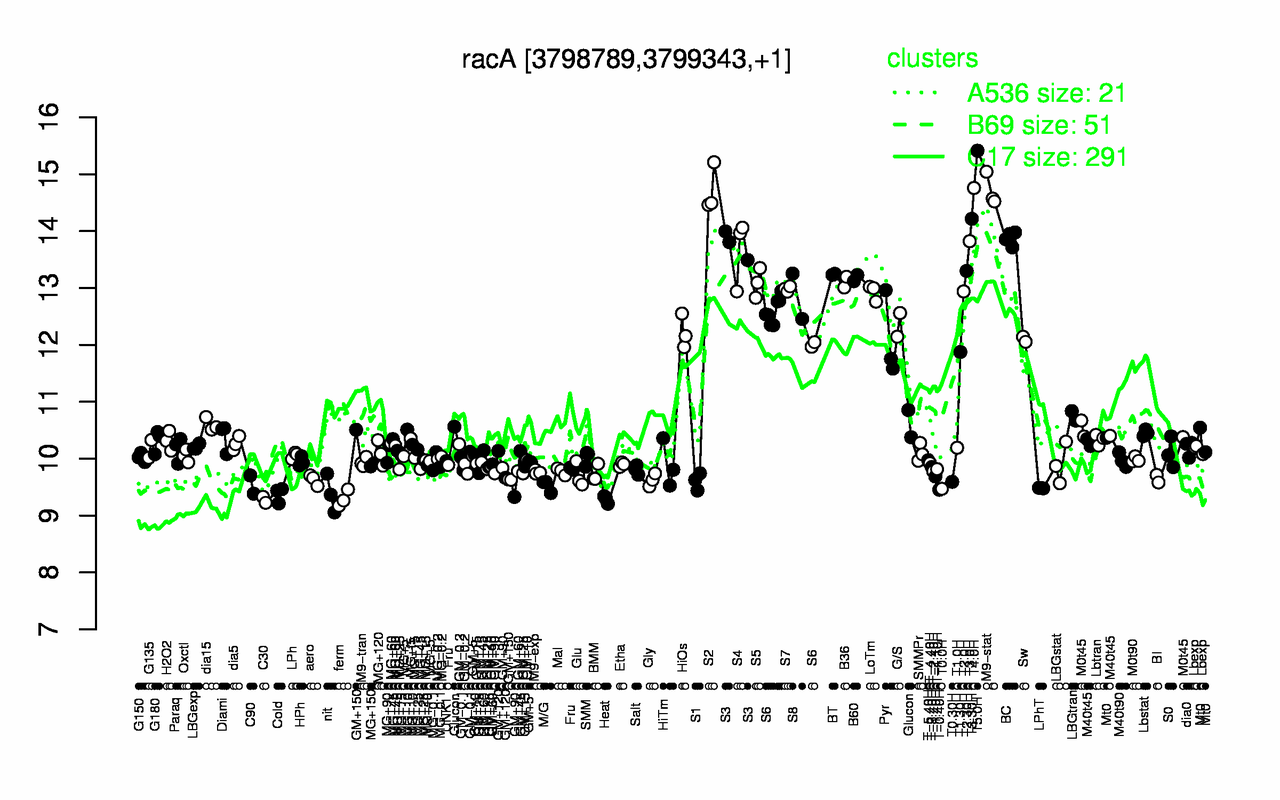
| T5.0H | T4.0H | S2 | M9-stat | T3.30H | BC | T3.0H | S3 | S4 | T2.30H |
| 15.4 | 14.8 | 14.7 | 14.7 | 14.2 | 13.9 | 13.8 | 13.8 | 13.7 | 13.3 |
| C30 | Heat | ferm | Cold | nit | T-0.40H | T0.0H | LPhT | M/G | C90 |
| 9.28 | 9.28 | 9.3 | 9.37 | 9.39 | 9.45 | 9.47 | 9.48 | 9.53 | 9.54 |